RSI Overview
As self-directed investors, we often attempt to have perfect execution. Whether that be purchasing a new stock or getting rid of a dud, we don’t want to sacrifice a penny more then we have to.
As a result, we’ll often freeze up when it comes to making new purchases or finally selling that stock. Even though the company is fundamentally sound (or fundamentally poor in the case of a sale) we think
“oh, it may run up this week, I’ll hold on to it a bit longer”
“oh, it may drop a bit this week, I’ll look to buy next week”
In the end, we end up missing out on purchasing a strong company and adding to our long-term portfolio.
However, there are some indicators you can use to at least help you time the entry and exits of stocks. These aren’t complex technical indicators used by high level traders. In fact, we use one of them all the time even as fundamental investors, and it is the Relative Strength Index (RSI).
We had a lot of members who are confused by the RSI when we speak on it, which is why we made this piece to provide a clear explanation so you can start using it to make better investment decisions.
What is the RSI, and how can you use it?
The Relative Strength Index is a momentum indicator, meaning it measures the magnitude of recent price changes to see if a selloff or rally has been overdone. Here at Stocktrades, we use the 14 day RSI, however it can be adjusted based on the amount of days you’d like to use.
As a fundamental investor, you’ll never need to know exactly how the RSI is calculated. Just know that the indicator compares the average gains and losses of a stock over the last 14 days and comes to a conclusion about the stocks overall movement.
So, how exactly do we determine whether a stock is due for a pullback or an increase in price?
One of the best things about using RSI is it’s simplicity. The RSI indicates 1 of 3 things:
Neutral – An RSI of 30 to 70 means that the stock is in neutral territory. It’s price fluctuations over the last 14 days do not signal the stock has moved too much in a single direction.
Oversold – An RSI below 30 means that the stock is currently in oversold territory. The current selloff of the stock is possibly overdone, and we could see a short term increase in price.
Overbought – An RSI above 70 means that the stock is currently in overbought territory. The current rally of the stock is possibly overdone, and we could see a short term decrease in price.
Now, stocks can remain in both oversold and overbought territory for a long time. There is no technical indicator that is 100% accurate. If there was, we’d all be rich.
However, we’ve found it to be extremely reliable and as a result RSI is the only technical indicator we have in our arsenal. Lets look at a few examples of some popular Canadian stocks to give you an idea of how the RSI works.
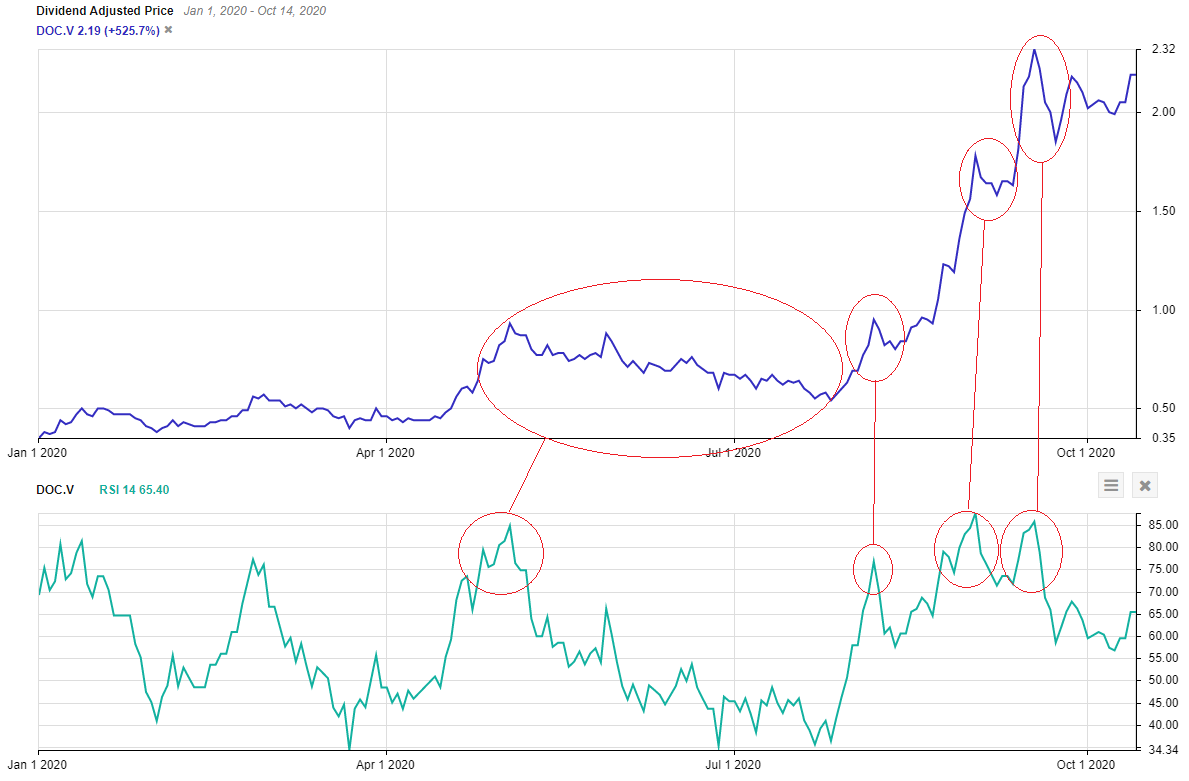
This is popular Canadian stock Cloud MD (DOC.V)’s year to date chart. There are more instances of the company going into overbought territory over the course of the year, but I’ve highlighted the most pronounced.
The first instance the stock entered overbought territory in what it seems like mid April caused a significant downturn in price for several months. You’ll notice that during this whole downturn, the stock never did enter into oversold territory. It just continued to trend downwards. After breaking out, it entered overbought territory again in our second instance and again, it corrected.
In our third and fourth instances however, the company never does dip back into “neutral” territory. It maintains an RSI above 70 and goes through some fairly crazy price fluctuations over the course of these two periods.
Cloud MD is a good example of a stock where you not only need to determine whether it is overbought or oversold, but how it’s reacting once it gets to those levels as well. In the third and fourth instance, you can see when CloudMD hit overbought levels of 80+, it corrected in a very extensive fashion, and very quickly.
Its most recent correction finally got the stock out of overbought territory.
A second example is a recent Bull List stock Real Matters (TSX:REAL)
The RSI has confirmed both oversold and overbought conditions with 100% accuracy on the stock in 2020.
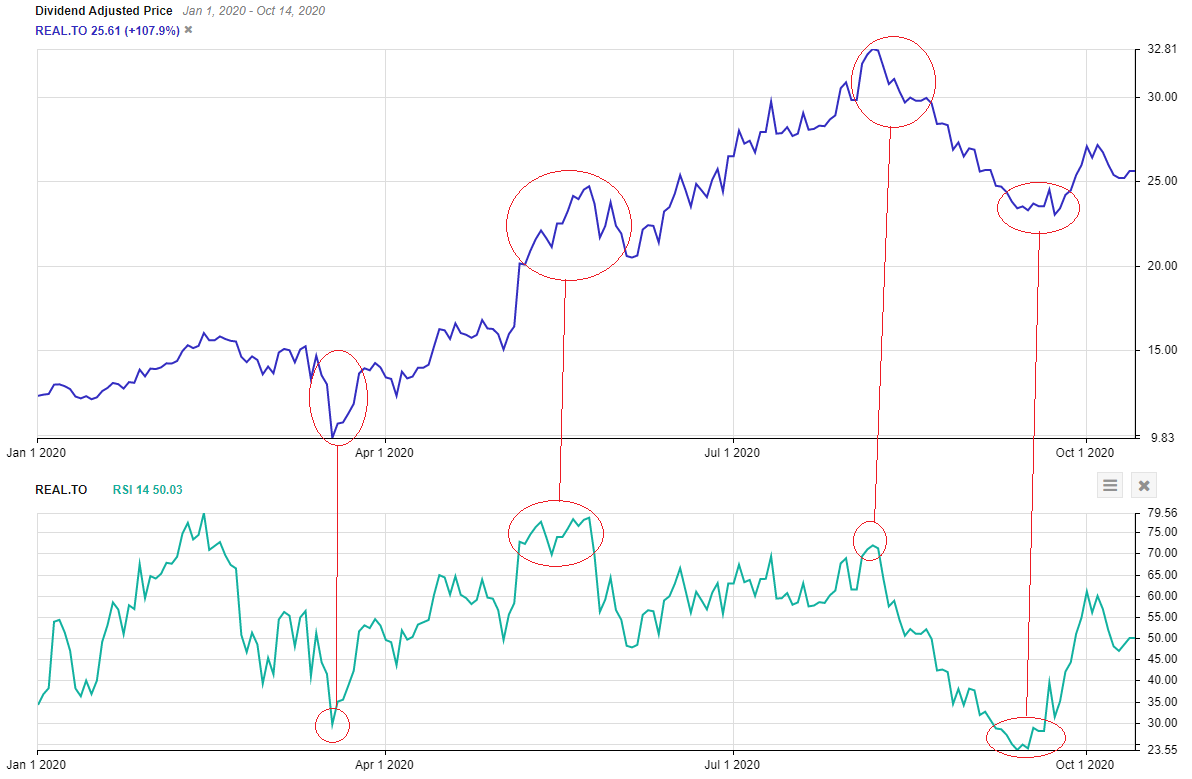
As we can see in March, like most stocks Real Matters hit oversold territory before correcting in a big way. In June, our second instance shows the stock hitting overbought territory and correcting shortly thereafter.
In late June and into July, the tech surge started and Real Matters went on a significant bull run. We can see that the stock briefly touched overbought territory before the selloff began in a big way. Our fourth and final instance, the stock touches oversold territory for a brief period and begins correcting in an upwards fashion.
Now, there are instances where the RSI does not work out
A solid example of this in 2020 would be Well Health (TSX:WELL).
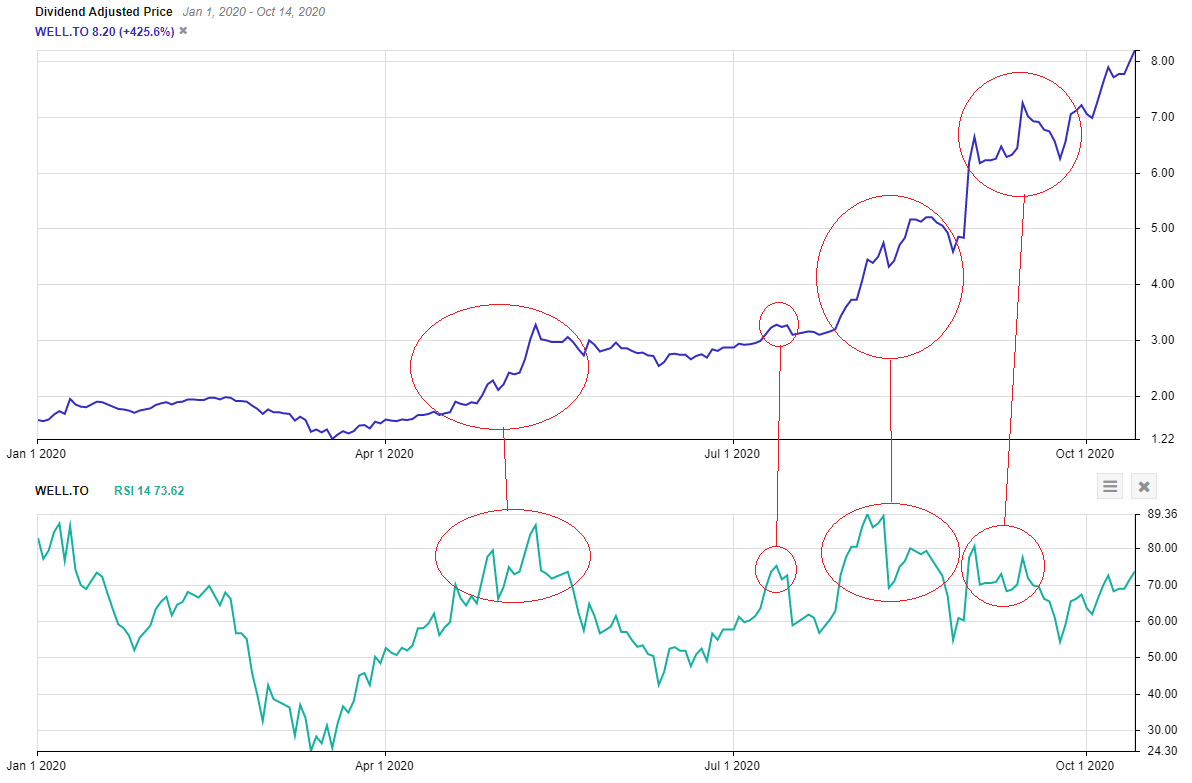
We can see that after the March crash, there was a total of 4 periods where Well Health entered overbought territory.
In the first instance, we can see if very briefly hit overbought territory, ducked under and then entered it again. T
here was short term price fluctuations that caused it to briefly dip in and out, but overall the stock maintained a strong upwards trend even though it entered overbought territory. It traded flat for a period of time after this, but it doesn’t make the harsh corrections like we saw with Real Matters and CloudMD.
In our second instance, we see the stock hit overbought territory and undergoes a very small correction, trades flat again and then continues its upwards surge, and in our third instance the technical indicator has almost zero reliance, with the stock continuing a very strong upwards trend even though it sits in overbought territory for what looks to be a month.
In our fourth instance, it does much of the same. Even with RSI levels in the 80’s, we see very small corrections followed by large increases. However, it did dip when the company finally exited overbought territory. But overall, the reliance on the RSI with Well Health in 2020 would be skeptical at best.
The RSI is very reliable, but not a magic wand
As we can see with a company like CloudMD and even more severe in Real Matters case, when these stocks hit overbought territory, we often saw a significant correction. CloudMD’s were relatively quick, while Real Matters seemed to drag out.
However, when we look at Well Health, the RSI has had relatively little bearing on the stocks price moving forward in 2020. Sure, when it hits overbought territory it has corrected, but not to the extend the other two examples have, and it often hasn’t corrected enough for the company to even exit overbought territory.
If you’re using the RSI to plan an entry or even an exit, you have to be willing to accept the fact that the price of the stock may not do what you want or expect it to do.
An example would be those who sold off Well Health in our third instance of being overbought in the chart above. The stock never corrected. In fact, it went from the low $3 range to $5+ a share before seeing any sort of correction.
Overall, use this indicator in combination with strong fundamental analysis
Your first step as always should be identifying strong companies. Whether that be using our suggestions, using our Top 20 and screeners or even our model portfolios.
A company with an RSI below 30 is oversold, and could very well see a short term bounce in price.
However, it’s absolutely critical you look into why the company is oversold. Take for instance Cinexplex (TSX:CGX). This is a stock that has hovered near or been firmly in oversold territory for a very long time. But there were fundamental reasons for this.
We don’t want to give investors the idea that you should be purchasing oversold stocks and quickly dumping them for profits when they break through an RSI of 30. And we especially don’t want to give investors the idea that they should be short selling overbought stocks.
We also don’t want to give investors the idea that they should be selling off strong stocks that have entered overbought territory. If long term fundamentals are strong, your best option is to hold the company for the long term. If you must, you could use the RSI to time your dollar cost averaging strategies however.
Fundamentals come first, and once you’ve identified a strong company, you can use the RSI to time entries. This isn’t a technical indicator that should be used on its own, but instead with strong research.