Stocktrades Foundation Stocks
Canadian Foundational Stocks
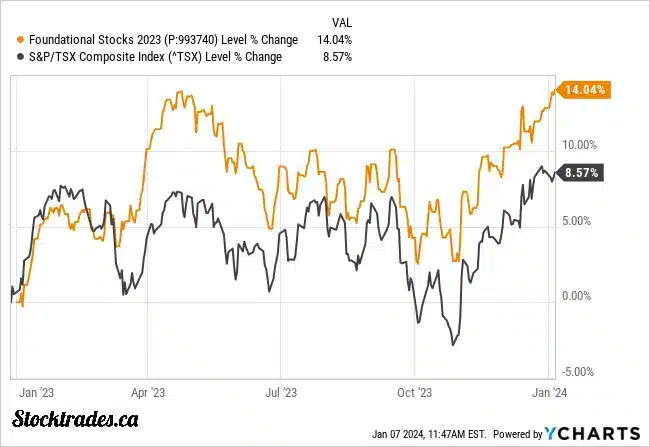
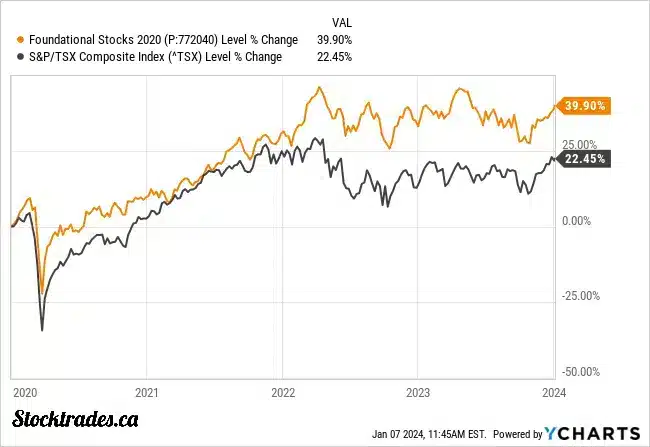
Previous data

Holdings
- Loblaw (L)
- Fortis (FTS)
- Granite REIT (GRT.UN)
- Waste Connections (WCN)
- Canadian Natural Resources Limited (CNQ)
- Canadian Pacific Kansas City (CP)
- Intact Financial (IFC)
- Brookfield Corporation (BN)
- Franco-Nevada (FNV)
- Alimentation Couche-Tard (ATD)
- Constellation Software (CSU)

Holdings
- Loblaw (L)
- Fortis (FTS)
- Granite REIT (GRT.UN)
- Waste Connections (WCN)
- Canadian Natural Resources Limited (CNQ)
- Brookfield Renewable Partners (BEP.UN)
- Royal Bank of Canada (RY)
- Telus (T)
- Franco-Nevada (FNV)
- Alimentation Couche-Tard (ATD)
- Constellation Software (CSU)
Holdings
- Loblaw (L)
- Fortis (FTS)
- Granite REIT (GRT.UN)
- Waste Connections (WCN)
- Canadian Natural Resources Limited (CNQ)
- Brookfield Renewable Partners (BEP.UN)
- Royal Bank of Canada (RY)
- Telus (T)
- Franco-Nevada (FNV)
- Alimentation Couche-Tard (ATD)
- Constellation Software (CSU)

Holdings
- Loblaw (L)
- Fortis (FTS)
- Granite REIT (GRT.UN)
- Canadian National Railway (CNR)
- TC Energy (TRP)
- Brookfield Renewable Partners (BEP.UN)
- Royal Bank of Canada (RY)
- Telus (T)
- Franco-Nevada (FNV)
- Alimentation Couche-Tard (ATD)
- Constellation Software (CSU)

Holdings
- Loblaw (L)
- Fortis (FTS)
- Granite REIT (GRT.UN)
- Canadian National Railway (CNR)
- TC Energy (TRP)
- Brookfield Renewable Partners (BEP.UN)
- Royal Bank of Canada (RY)
- Telus (T)
- Franco-Nevada (FNV)
- Alimentation Couche-Tard (ATD)
- Constellation Software (CSU)
Holdings
- Loblaw (L)
- Fortis (FTS)
- RioCan Real Estate Investment Trust (REI.UN)
- Canadian National Railway (CNR)
- Enbridge (ENB)
- Brookfield Renewable Partners (BEP.UN)
- Royal Bank of Canada (RY)
- Telus (T)
- Franco-Nevada (FNV)
- Alimentation Couche-Tard (ATD)
- Constellation Software (CSU)
Happy New Year! The updated list of Canadian Foundational Stocks will be live on January 7th.
Changes for 2026
I replaced Fortis (TSE:FTS) with WSP Global (TSE:WSP)
I did this as a unique spin on the Foundational Stock list this year. Make no mistake, Fortis is still a core holding in my portfolio and will remain one. It is, in every right, a “foundational” holding, one that experienced a nice run-up in returns over the last while with declining interest rates.
However, I found myself thinking, how one could get exposure to the expansion of the power grid due to increasing demand. As a regulated utility, Fortis is not set up to benefit as much as, say, an independent power producer like Capital Power, for example. Capital Power, although an outstanding company, is not quite at the pedigree of Foundational just yet.
What became clear to me, however, is that one can get exposure to this energy build-out through a company that is aggressively positioning itself in the power market. And the best part is, they don’t even have to put a shovel in the ground. That company is WSP Global.
This swap is a high-conviction bet on the massive capital expenditures required to modernize and expand the power grid over the next decade, and how WSP will be the engineer for a large chunk of that. More on this in my WSP writeup below.
I replaced Alimentation Couche-Tard (TSE:ATD) with TMX Group (TSE:X)
As I mentioned last year, I got rid of the idea that I needed to have one stock from each sector in the Foundatonals. It made inclusions in this list awkward, as I was excluding companies that I knew were higher quality but left off the list because there was already a stock in their sector on the list. I think TMX Group fits that bill. Sure, Brookfield and TMX Group are both “financials,” but these companies couldn’t be more different.
Now, let’s speak on Couche-Tard. This is a company that has been on the Foundational Stock list since its inception in 2021, and is a popular stock here among Premium members.
While Alimentation Couche-Tard remains a world-class operator, the decision to remove it from the Foundational List in 2026 centers on what I feel is a shift in the convenience retail landscape. The primary concern is no longer about the company’s ability to acquire new stores, but rather its ability to kickstart organic growth within its existing ones. After years of being a reliable compounding machine, Couche-Tard is now facing a structural hangover from post-pandemic inflation.
For decades, the convenience store model relied on high-margin, low-ticket impulse items, specifically snack foods and packaged beverages, to drive profitability. However, inflation in the snack category has been nearly double that of total food inflation over the past two years, with prices for items like salty snacks and confectionery rising by as much as 15% to 18%.
This has pushed the price of a single bag of chips or a candy bar past a psychological breaking point for the average commuter. We are seeing a clear trend where consumers are becoming numb to volatility and are making much more intentional, budget-conscious decisions. Instead of grabbing an extra snack at the counter, shoppers are increasingly practicing austerity at the pump, skipping the trip inside the store entirely to avoid high-priced convenience markups.
While Couche-Tard has managed to “hold the line” on margins, transaction counts inside the store have been flat at best, and unit sales in top categories are actually in decline across the industry. The convenience of a Circle K used to outweigh the price premium, but in 2026, that value proposition is being tested as consumers trade down to private labels or wait to buy in bulk at “mass” or “club” retailers.
Furthermore, the rise of health-conscious behaviors and the increasing adoption of GLP-1 medications are creating a quiet but persistent headwind for the high-calorie, processed snacks that represent Couche-Tard’s highest-margin merchandise. The company is trying to transition to a fresh food style offering. However, I’m just not all that convinced this will work in a convenience store.
With all that said, I still believe Couche-Tard is an outstanding company. A blue-chip worthy of a long-term buy and hold. The core business model, that being selling fuel, cigarettes, hot dogs, etc, should still do well.
I just think TMX Group will move the needle a bit more over the next 5+ years here. I am not sure how Couche-Tard navigates around the inflationary pressures that have been put on the company. Paying ~$9 for a large bag of chips just isn’t worth the convenience for many anymore. They’d rather drive the extra bit to a retailer and get their snacks for half the price.
2026 Canadian Foundational Stocks
Brookfield Corporation (TSE:BN)

Brookfield Corp. engages in the management of public and private investment products and services. It operates through the following business segments: Asset Management, Renewable Power and Transition, Infrastructure, Private Equity, Real Estate and Other Alternatives. The Renewable Power and Transition segment involves the provision of hydro, wind, utility-scale solar, distributed generation, storage, and other technologies. The Infrastructure segment includes the operation of assets in the utilities, transport, midstream, and data sectors. The Private Equity segment focuses on acquiring businesses.
Brookfield’s diverse portfolio exposes investors to some of the highest-quality assets on the globe. Brookfield Corp is like a mini-ETF with exposure to a variety of industries through their interests in Brookfield Infrastructure (BIP.UN), Brookfield Renewables (BEP.UN), Brookfield Property, Brookfield Asset Management (BAM), and its majority stake in Oaktree, which gives investors exposure to credit and insurance offerings.
The primary thesis behind an investment in Brookfield today is the company’s ability to acquire assets with relatively little competition, utilize decades of experience to improve the asset and, ultimately, its underlying value. In addition, most of the company’s portfolio is what we call “real” assets. Think of things like pipelines, electrical transmission lines, and real estate, tangible physical assets. During times of higher inflation, these tangible assets have outperformed.
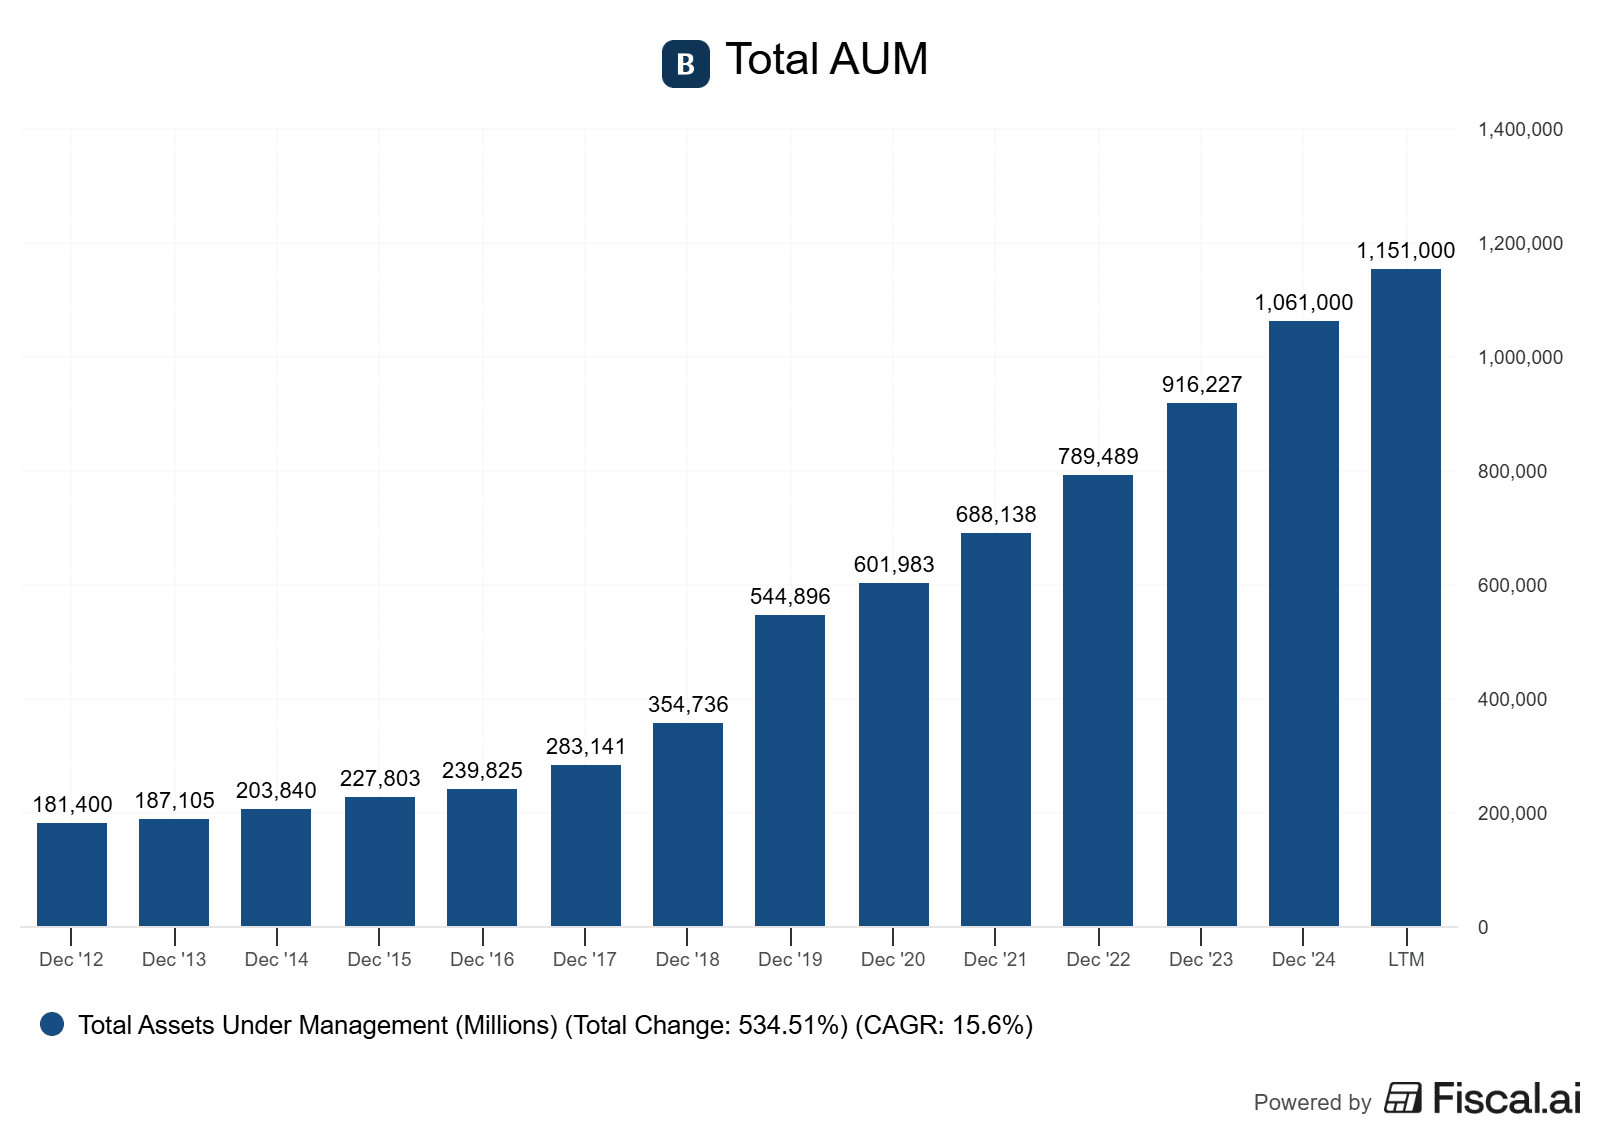
Why such little competition? The company seeks out assets that may need some sort of operational turnaround or further development. Assets that other managers may not want to take on. Acquisitions are often cheaper, and as a result, the company can drive significant growth in AUM (Assets Under Management) and FFO (Funds From Operations).
In 2026, the case for the parent company over its individual subsidiaries is stronger than ever, as Brookfield has successfully transitioned into a Berkshire-style model, utilizing its massive insurance and wealth solutions arm as a permanent, low-cost capital engine. While the individual units like Infrastructure or Renewables provide excellent sector-specific exposure, the Corporation acts as the master corporation, capable of pivoting billions of dollars into whichever megatrend offers the highest risk-adjusted returns. Whether it be global infrastructure, renewables, AI, etc.
By scaling its insurance assets following the acquisition of the UK’s Just Group and entry into the Japanese market, Brookfield has secured a massive float. This capital is uniquely suited for Brookfield’s real asset expertise; they can invest insurance premiums into the very same high-quality infrastructure and credit assets they manage, capturing the spread between low-cost liabilities and high-yielding private assets. This creates a powerful internal flywheel where the insurance arm provides the capital, the asset management arm (BAM) earns the fees, and the Corporation (BN) retains the compounding value of the equity.
Brookfield is also currently positioned at the center of the $7 trillion AI infrastructure boom. As the global economy faces a bottleneck in power and computing capacity, Brookfield is one of the few entities on earth with the scale to build the digital backbone required for the next decade. Their integrated approach, which can pair data center infrastructure with the power required to run it, makes them the partner of choice for hyperscalers like Microsoft and Amazon.
By owning BN versus one of its individual subsidiaries, investors benefit from this S-curve of AI adoption. How? You get exposure to the infrastructure needed to house the chips, the clean energy required to power them, and the private credit used to finance the entire chain.
Finally, we are entering a peak period for the realization of carried interest (performance fees), which management expects to unlock billions in additional distributable earnings over the next five years. Despite the stock reaching all-time highs, it continues to trade at a significant discount to its Net Asset Value (NAV), a gap that management is aggressively attacking through record-setting share buybacks. By repurchasing shares at a 25–50% discount to intrinsic value, Brookfield is effectively “buying the world’s best assets” at half price for its remaining shareholders.
Overall, I still believe it is one of the best companies in the country, and is poised for a strong decade.
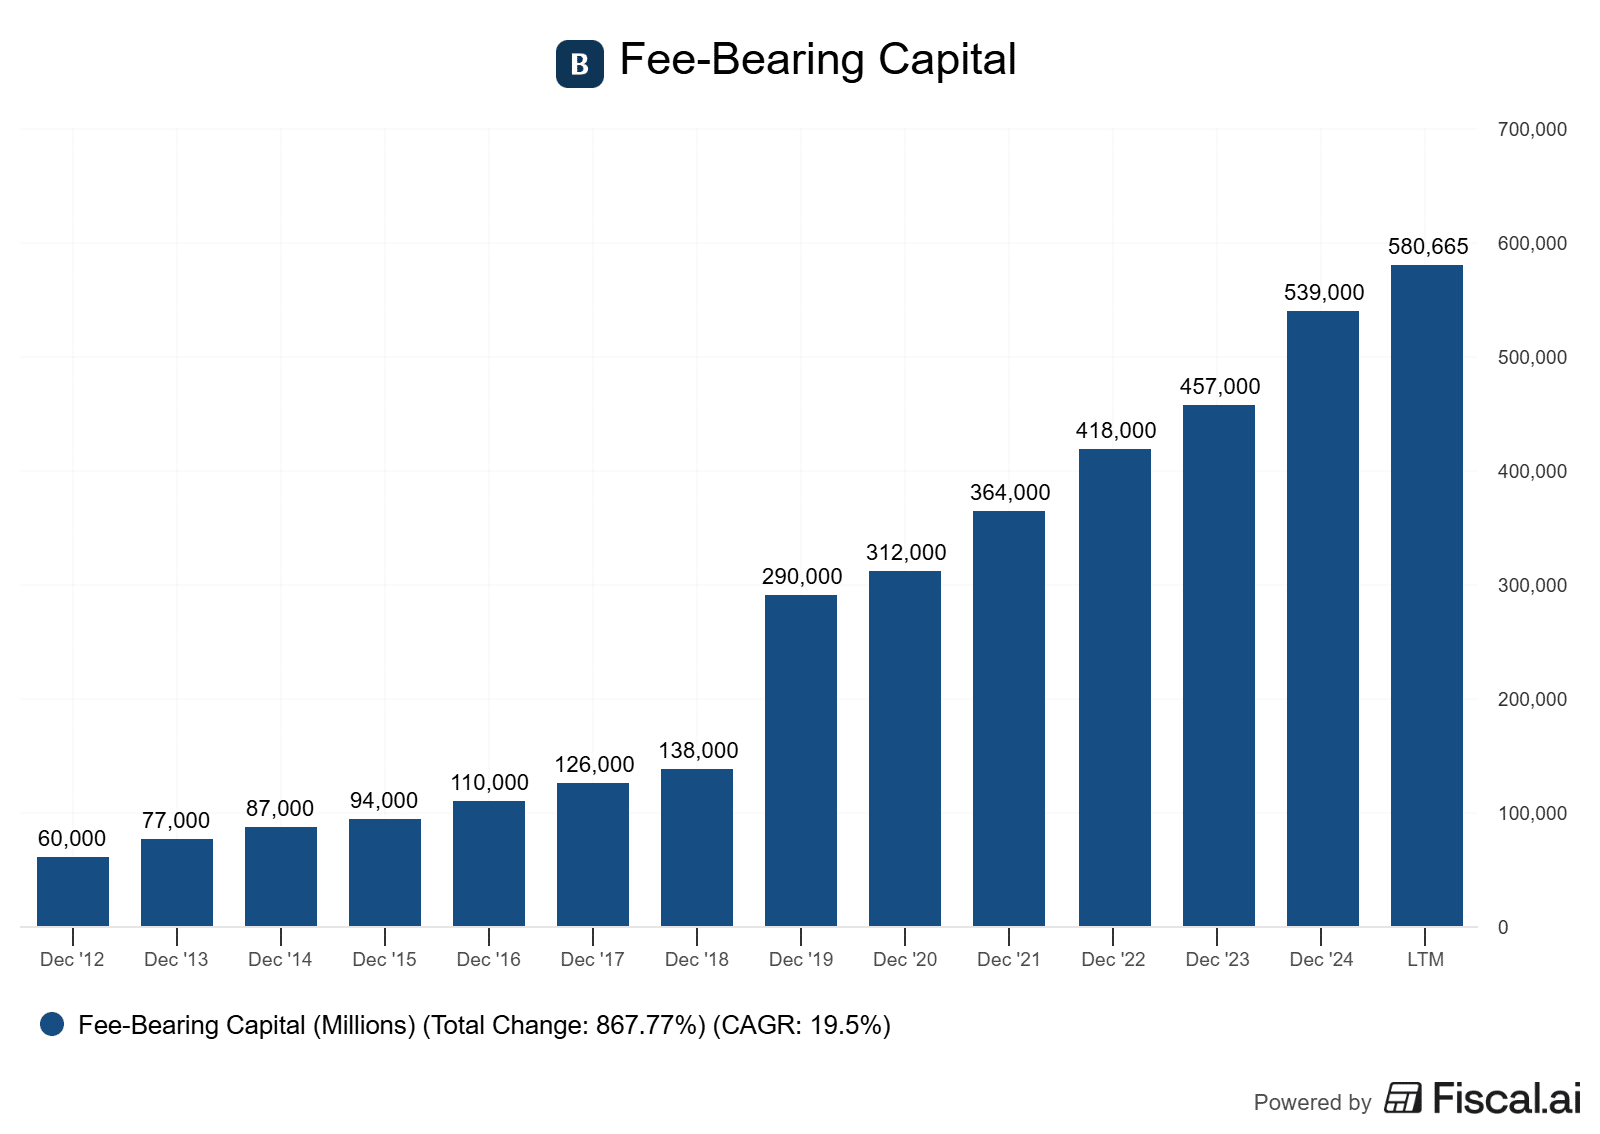
- Growth in fee-bearing capital. Brookfield’s fee-bearing capital is the lifeblood of its business. Ultimately, fee-bearing capital increases fee-related earnings, which are by far the company’s most consistent form of cash flow.
- AI expansion. The most aggressive trend for 2026 is Brookfield’s move to control the entire AI stack. The company is launching a lofty $100B+ AI plan. It is fairly obvious that Brookfield is moving beyond just owning the data center buildings.
- Insurance growth. Brookfield is expanding its presence in the private credit and insurance space, which are high-growth, high-margin businesses. Outsized growth in this department will no doubt fuel strong tailwinds for its stock price.
- Carried interest impacts. After a decade of building, Brookfield is moving into a major “harvesting” phase. The company entered 2026 with roughly $11.3 billion in unrealized carried interest (performance fees) sitting on the sidelines. In 2026, I want to see this “carried interest” move from the balance sheet into distributable earnings.
When we look to Brookfield, we want to pay attention to 3 KPIs. The first being distributable earnings. This is a more important measure for something like Brookfield than earnings per share, simply due to the complex nature of the business. DE is calculated by including cash earnings from Brookfield’s various business segments, such as asset management, wealth solutions, and operating businesses, while excluding certain non-cash items.
The second KPI is fee-bearing capital. This one is fairly self-explanatory. It is the capital that Brookfield manages that is able to generate fees, a strong revenue stream for the company. And finally, the third KPI would be assets under management.
Click the images to expand them if needed!
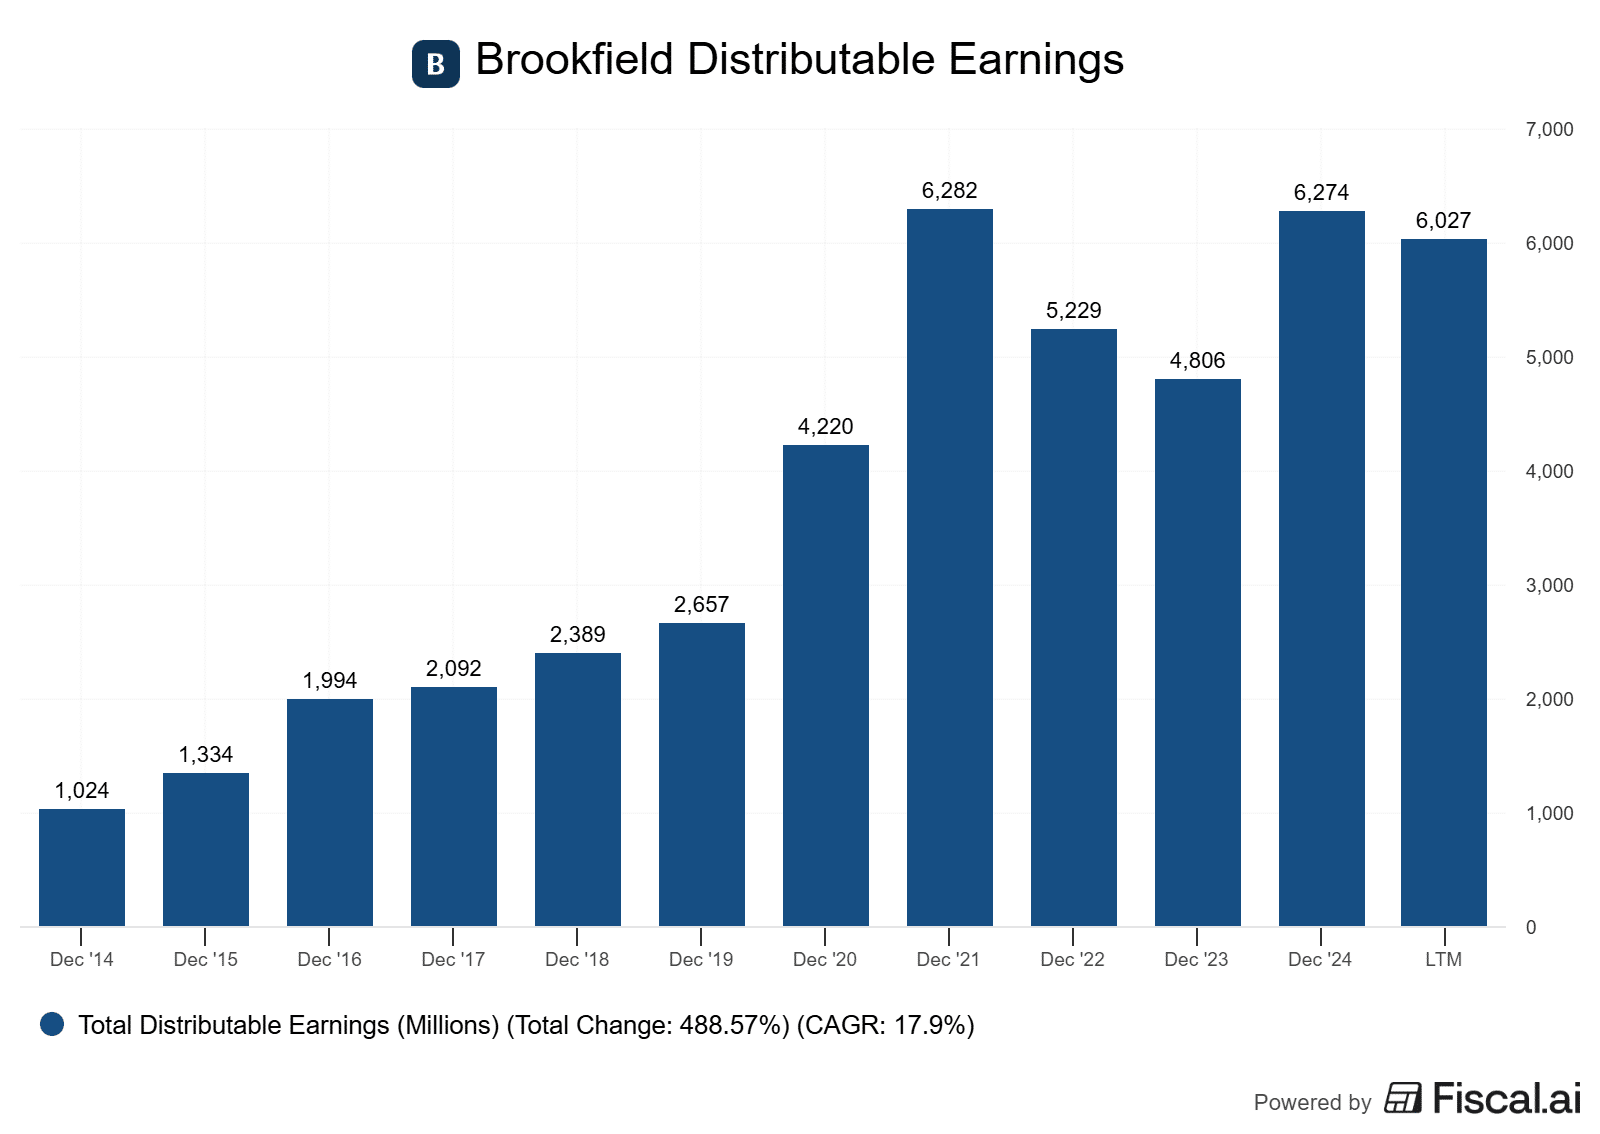
November 14, 2025 – Brookfield Corporation delivered another strong quarter in Q3 2025, but a slowdown in distributable earnings growth caused some volatility in its share price post-earnings.
Distributable earnings before realizations came in at $1.3 billion ($0.56 per share), with trailing twelve-month DE up 18% year-over-year to $5.4 billion ($2.27 per share). So yes, although they didn’t grow as much as anticipated, 18%~ growth is still outstanding, and highlighting the fact that Brookfield can grow through pretty much every cycle.
This strength was spread across all of the core pillars of the business, asset management, wealth solutions, and all of its operating businesses (BEP,BIP for example). What I noticed on the call is managements confidence, despite results this quarter being a bit lower than expected. However, this is pretty normal with Brookfield.
In asset management fee-related earnings increased 17% to a record $754 million, driven by strong fundraising activity. The company had $30 billion in inflows this quarter alone. Fee-bearing capital reached $581 billion, boosted by the close of Brookfield’s second flagship energy transition fund at $20 billion, the largest private fund ever in this category.
More broadly, Brookfield is positioning its asset management platform for the future, including the launch of a dedicated AI infrastructure fund and the acquisition of the remaining 26% of Oaktree Capital, further expanding its reach into private credit. I am a touch concerned that Oaktree’s decision to sell its remaining stake to Brookfield is because of the frothiness in the private markets. However, I have full confidence that Brookfield can navigate the situation.
The Wealth Solutions business generated $420 million in distributable earnings this quarter, with over 15% organic growth. This is where I’m most impressed, honestly. The business is scaling rapidly, with $5 billion of annuities originated this quarter and insurance AUM now at $139 billion.
Brookfield’s operating businesses contributed $336 million in DE this quarter. Through Westinghouse, Brookfield will deliver $80 billion in new U.S. nuclear reactors. One line that really hit home for me is that these plants are the “equivalent to powering the state of Utah”.
Additional initiatives include a 1 GW fuel cell power partnership with Bloom Energy to meet AI-related energy demand and a robotics platform partnership. These efforts signal Brookfield’s mentality of “going where the puck will be” instead of focusing on what has worked in the past.
Brookfield repurchased over $950 million of its own shares year-to-date. The craziest commentary about this is the fact that management believes it is doing so at a 50% discount to intrinsic value. This is not only a large signal of confidence from management that it can drive shareholder value in the future, but also the fact it believes its shares are deeply discounted despite a large run up in price over the years.
Brookfield continues to benefit from being in the right businesses at the right time, and its platform is increasingly oriented toward where capital is flowing, that being the energy transition, AI infrastructure, retirement solutions, and real estate. While execution remains key, particularly in deploying insurance capital efficiently and realizing carry from maturing funds, the overall setup looks very favorable moving forward.
With massive dry powder, scale advantages, and a macro backdrop potentially shifting toward lower real yields, Brookfield is not only well-positioned to weather any volatility but also to be a primary beneficiary of the next upcycle in real assets.
WSP Global (TSE:WSP)

WSP Global deploys a range of workforce ranging from engineers, technicians, scientists, planners, surveyors, environmental specialists, as well as other design, program, and construction management professionals. It designs commercial, residential, government buildings, sports centers, skyscrapers, renewable facilities, data centers, and more. It specializes in the field of buildings, infrastructure, including transportation, municipal infrastructure, industrial and energy such as mining, oil and gas; and environment. The company covers its services throughout all project phases of execution including initial development, planning studies, design, construction, commissioning, and maintenance. It operates in the following areas: Canada, America, Europe, the Middle East, India, Africa, Asia and the Pacific.
Moving WSP Global from the Bull List to the Foundational Stock List in place of Fortis might be confusing. After all, one is an engineering firm and the other is a regulated utility. However, one of my core theses with WSP is that it is no longer just an engineering firm. It will be a primary architect of a global revolution in terms of green energy, data centers, and extensive government spending.
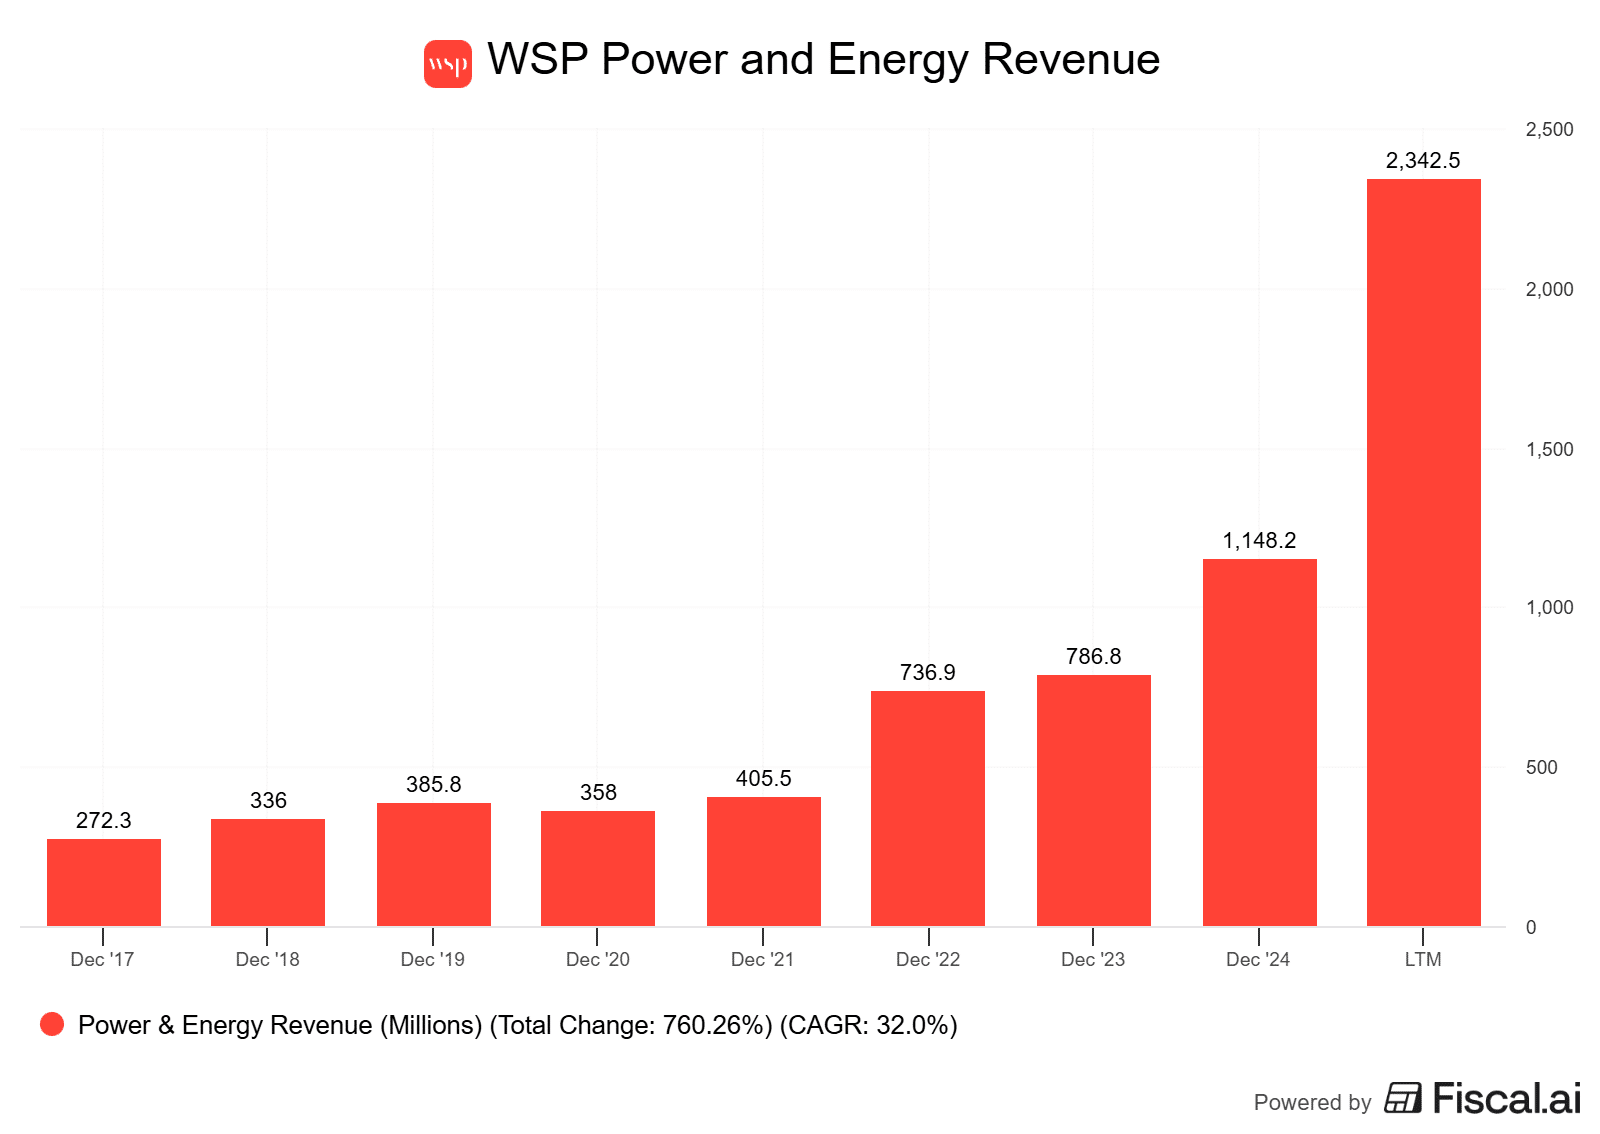
So, why the replacement of Fortis? The most aggressive, and perhaps most misunderstood, part of WSP’s strategy is its calculated move into the Power & Energy vertical. Through acquisitions like POWER Engineers and the agreement in late 2025 to acquire TRC Companies, WSP has positioned itself as the #1 power and energy platform in North America. In fact, it makes up nearly a third of the business now.
WSP isn’t just diversifying just for the fun of it. This is a calculated play on future grid expansion. As governments and corporations push toward net zero and artificial intelligence, the aging power grid requires a total overhaul. By acquiring the top talent in energy transmission and distribution, WSP has created a “toll booth” on energy transition spending. They are the ones being hired to design the complex systems that utilities like Fortis or Capital Power need to build.
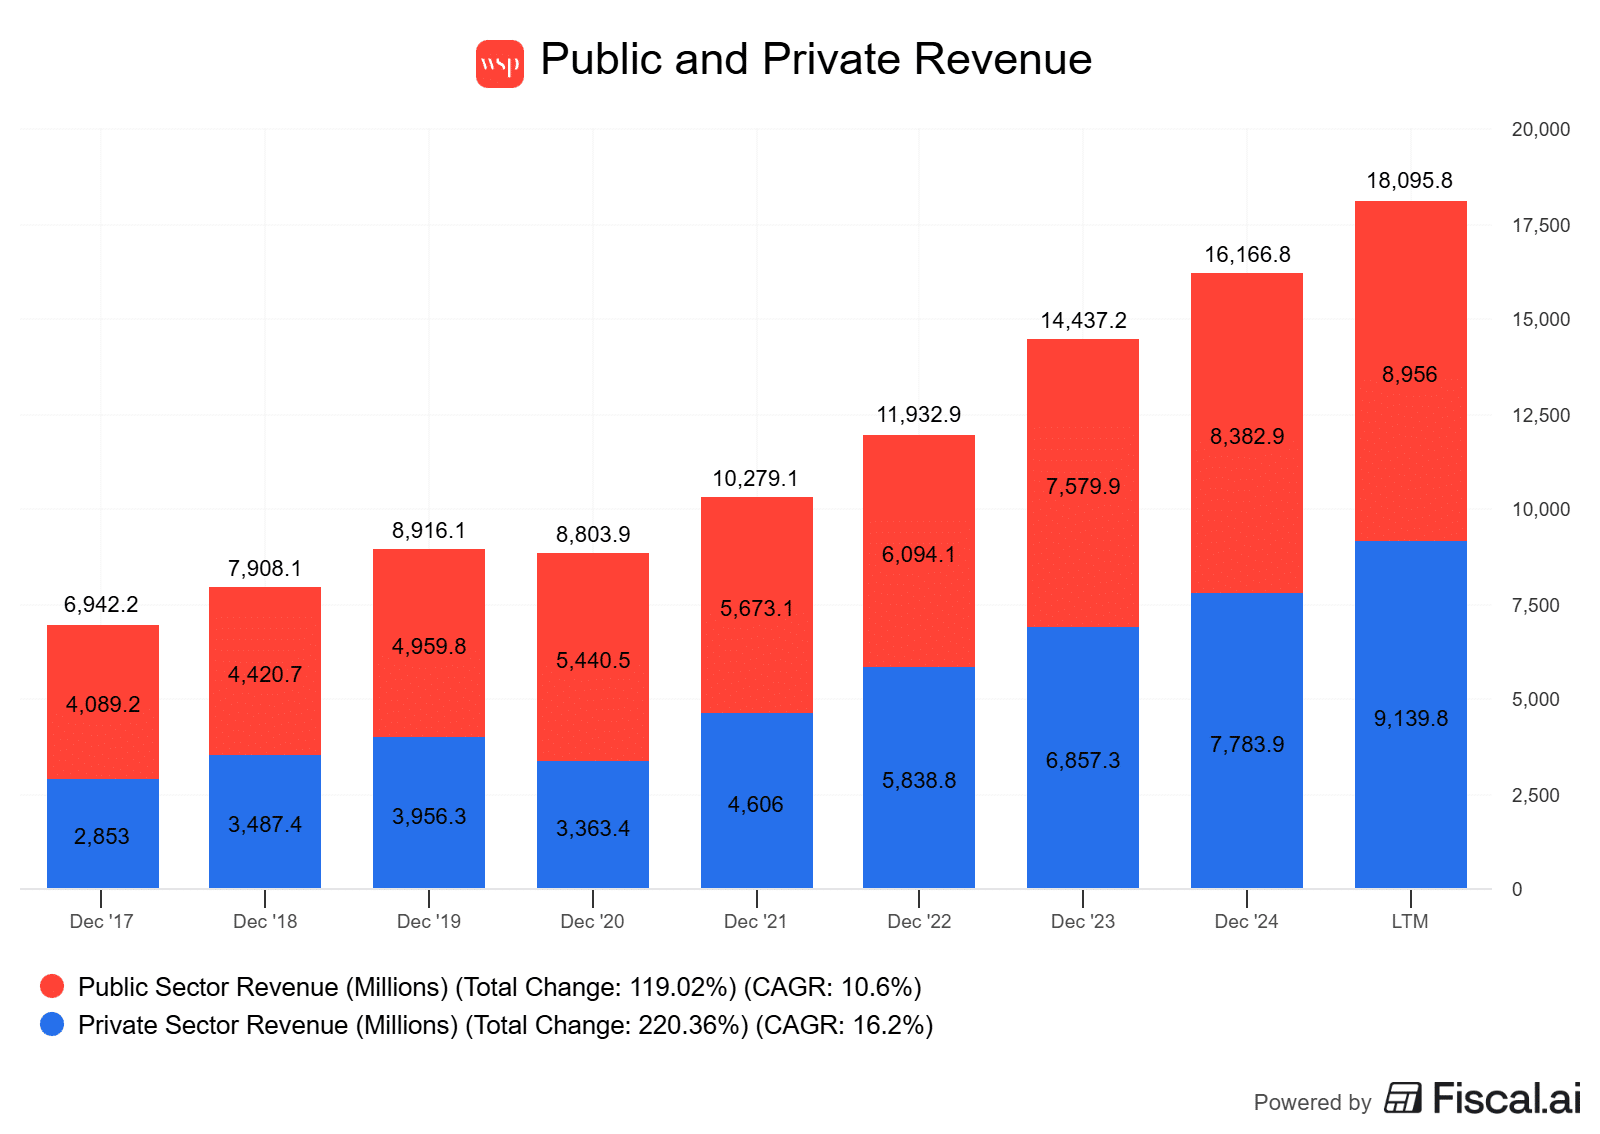
Outside of renewables and AI spending, infrastructure expansion is currently accelerating at a pace not seen in decades. WSP is a direct beneficiary of a massive wave of global government spending, primarily because of their strong mix of revenue streams. WSP maintains a healthy 50/50 split between public and private sector revenue. This provides a defensive floor during economic downturns (government projects) and high-growth upside during recoveries (corporate spending).
The unique spin for 2026 is WSP’s exposure to the AI revolution. Data centers require immense power, cooling, and structural buildouts, all of which are right up WSP’s alley. This creates a high-growth area that is different from traditional construction cycles.
The company’s backlog is currently sitting at record levels ($16.4B), representing roughly 11 months of revenue.
I will no doubt get the question “why not AtkinsRealis?” And the main reason is WSP doesn’t swing hammers, Atkins does. WSP does not take on fixed-price construction risk. In a fixed-price contract, if the cost of steel or labor spikes, the builder (AtkinsRéalis) eats the loss. This is why you tend to see Atkin’s share price be lumpy, while WSP’s is generally smoother. Because WSP is primarily selling expertise and hours, their margins are far more stable and predictable.
The reason AtkinsRéalis has had such a volatile history leading to their rebranding (formerly SNC Lavalin), was their exposure to Lump Sum Turnkey (LSTK) projects. These are massive, multi-billion dollar construction projects where the firm is responsible for every cost overrun. This led to the scandals and massive write-downs that plagued SNC-Lavalin for years.
From a valuation perspective, WSP is rarely cheap. It currently trades at a premium to its peers, but this is a classic “Growth at a Reasonable Price” (GARP) situation, which are my favorite type of holdings.
The company has broken out with double-digit organic growth for the first time since 2022, adjusted EBITDA margins have just hit record highs, and the company’s leverage ratio is healthy enough to support plenty of future deals. Outside of maybe the idea the company is often a bit pricey, I find it hard to find things to dislike about WSP.
- The Energy Transition. The key trend to follow in 2026 is the organic growth rate within the Power & Energy segment. With global utilities frantically upgrading aging grids to handle renewables, data centers, and EV demand, WSP’s backlog should reflect a shift toward these high-margin, multi-year consulting contracts.
- Continued margin expansion. In 2025, adjusted EBITDA margins hit a record 20.2%. The goal is to see if WSP can push this toward 21%–22%. If they can use AI internally to do work in half the time but still bill full hours, the leverage will result in outsized earnings growth without having to hire new engineers.
- Government spending. Government spending in 2026 is heavily weighted toward the climate and catastrophes. For example, protecting existing infrastructure from floods, fires, and extreme weather. WSP is best in class for environmental consulting, which is often the first phase of any major project. This should be an added tailwind for the company in 2026.
- Acquisitions/Leverage Ratio. WSP is an outstanding operator when it comes to acquiring firms, stripping out excess costs (thus improving margins) and merging them into the fold. This is the company’s bread and butter, and there are still plenty of fish in the sea. The company’s leverage ratio has increased above 2x because of the acquisition of TRC. In 2026, keep an eye on any potential acquisition activity. It is unlikely they make a big splash until they get back to a ~1.5X leverage ratio, but it’s possible.
WSP’s Key Performance Indicators are simple. Backlog represents the total value of signed contracts yet to be performed, providing a look at future revenue and the health of the sales pipeline. The public versus private revenue split measures the balance between government infrastructure projects and higher-growth corporate contracts. 50/50 is a perfect mix, in my opinion.
Organic growth is the most honest reflection of WSP’s internal growth as it strips away the impact of acquisitions to show how well the core business is winning new work. Finally, tracking power and energy revenue specifically allows investors to gauge the success of the company’s pivot into grid modernization and renewable energy, which are the primary drivers of my current thesis.
Click the images to expand them if needed!
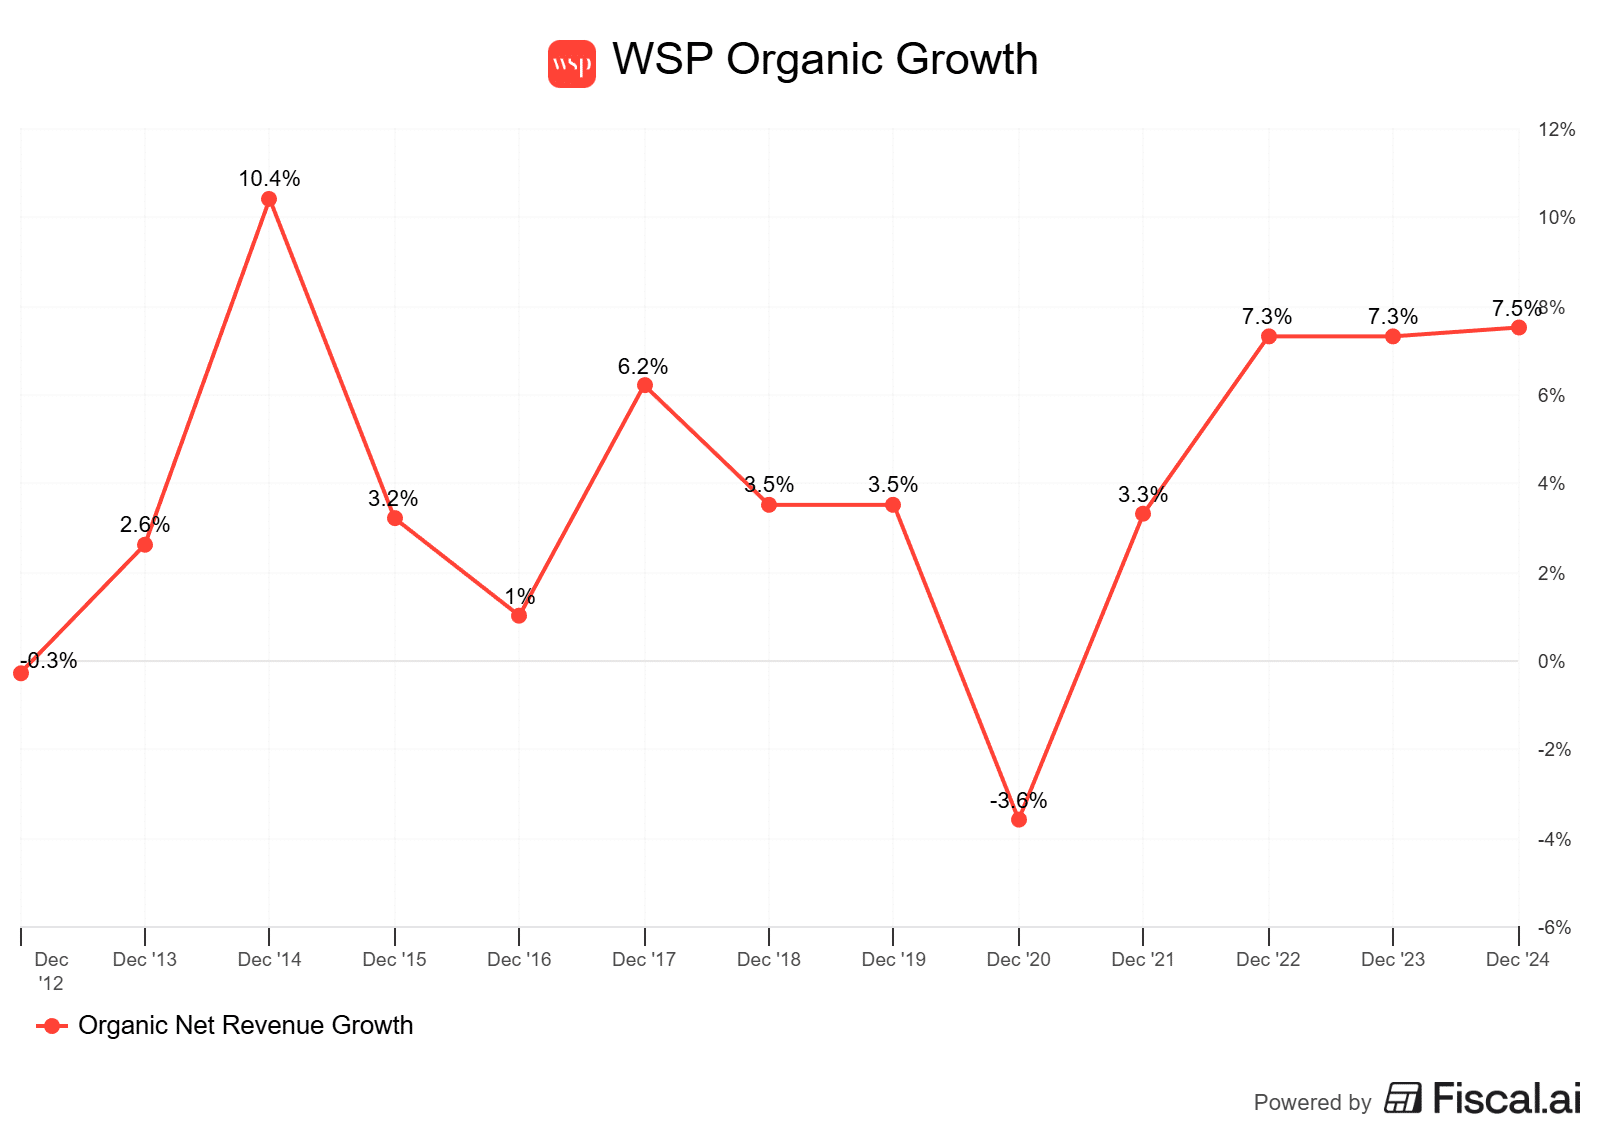

February 26, 2026 – WSP Global capped off an outstanding 2025. Not only did it post record-breaking financial metrics, arguably the more important element was its shift toward the Power & Energy sector. As the saying goes, they’re going to where the puck is going, not where it’s been.
Total revenues increased 13.1% to $18.29B, at the higher end of managements original guidance. Adjusted EBITDA grew 17.2% to $2.56B, with margins expanding 39 basis points to 18.3%. This is one of the higher margins in the industry, and despite this being the case, WSP still continues to grow it quarter after quarter.
The best part? Management highlighted that underlying margin growth was actually 80 basis points when stripping out 40 basis points of restructuring costs. This means that once restructuring is over, margins should continue to expand further.
The company’s cash position has never been better. Free cash flow hit a record $1.7B, representing 180% of earnings. The company’s typical ratio is around 100% conversion. What is happening is acquisition costs and non-cash costs are hitting the income statement, reducing earnings, but are not impacting cash flows. What this ultimately means is WSP is doing a good job at integrating acquisitions. They’re starting to see it in free cash flow, and will eventually see it in earnings.
Cash generation was helped by a historic low in Days Sales Outstanding (DSO) of 63 days. This shattered the previous year’s 72 days and beat the company’s 67-73 day target range. What this tells you is WSP is issuing bills and getting paid quicker than ever before, which is a very good sign.
WSP’s performance on a regional basis was once again led by Canada, which saw mid-to-high single-digit organic growth and a 13.5% backlog increase. The U.S. business is thriving with a 15% increase in its project pipeline, where Power & Energy now makes up roughly one-third of the total US business. The EMEIA region posted double-digit growth in the UK and a 25% surge in its pipeline to close out the year.
For a long time I’ve mentioned the Asia Pacific region was a big struggle, albeit a small portion of the business. We’re seeing a turnaround here. It returned to organic growth in the second half of the year because of critical infrastructure buildouts from governments, such as the Sydney Metro West and New Zealand’s “Roads of National Significance” program. If WSP can get this segment rolling again, it will bring large tailwinds with it.
WSP’s backlog hit $17.1B (up 9.9%), representing 11 months of revenue. The company’s win rate on high-impact projects jumped 10% in the U.S. and 25% in the UK. This success is primarily backed by $7B in Power & Energy investments over the last 15 months, including the acquisition of Power Engineers (which saw mid-teens growth in 2025), TRC, and the technical expansion provided by Ricardo in the UK.
The company is utilizing AI to provide a much higher quality client experience as well. Previously, the company might have engineered 5 situations to give to a client to review. Now, they can provide thousands of potential solutions in a fraction of the time it took to create 5 due to AI.
Overall, the results were outstanding, and this one remains one of my top options alongside Toromont Industries for the anticipation of large scale infrastructure rollouts during this AI boom. Any dip in this company’s share price is just an opportunity to add more shares, in my opinion.
Canadian Pacific Kansas City (TSE:CP)

Canadian Pacific Kansas City is a Class-1 railroad operating on track that spans across most of Canada and into parts of the Midwestern and Northeastern United States. Following the April 2023 Kansas City Southern merger, CP operates new single-line-haul services from Canada and the Upper Midwest down through Texas, the Gulf of Mexico, and into Mexico. It also hauls cross-border and intra-Mexico freight via operating concessions on roughly 3,300 miles of rail in Mexico. CP hauls shipments of grain, intermodal containers, energy products (like crude and frac sand), chemicals, plastics, coal, fertilizer and potash, automotive products, and a diverse mix of other merchandise.
For the first time in over two decades, the North American rail sector has underperformed the broader TSX for three consecutive years. This is a rarity for an industry that has historically been the bedrock of Canadian industrial outperformance, but it has created a “coiled spring” effect for the patient investor, in my opinion.
The primary culprit has been a horrendous freight environment. A “freight recession,” characterized by cooling consumer demand and erratic volumes. However, when we look to the railways, the cycles always turn. As we head into 2026, the inventory destocking of the post-pandemic era has largely run its course, and we should be entering into a recovery-like situation. Sure, it might not immediately happen in 2026. However, it is hard not to envision it happening over the next couple of years.
The best part about this is that CP hasn’t just been sitting back and taking punches during this brutal environment. They have spent the last three years building the most unique competitive advantage in the history of North American logistics.
While the market focused on the soft economy, CPKC was busy perfecting the only single-line rail network connecting Canada, the US, and Mexico. This isn’t just a bigger version of the old CP. I would argue it’s an entirely different company.
Mexico is now the top trading partner of the US, and the nearshoring trend is shifting manufacturing away from Asia and toward North America. CPKC’s MMX (Mexico Midwest Express) service is already delivering short-term transit times from Mexico to the US. This is high-margin, “sticky” freight that CN Rail simply cannot touch without an interchange.
Even in a weak 2025 freight environment, CPKC managed to grow revenues by 3% and EPS by double digits through sheer pricing discipline and synergies from Kansas City Southern. As volumes in grain, automotive, and intermodal begin to recover in 2026, CPKC will be applying these higher price points to a much larger network, creating massive operating leverage.
Perhaps the most bullish signal for 2026 is the pivot in management’s capital allocation. During the 2021–2022 period, when rail valuations were at peak levels, CP was noticeably disciplined, pulling back on aggressive share buybacks and dividend growth to preserve capital for the KCS acquisition. CN Rail, on the other hand, spent a ton of money on buybacks at peak prices.
Now that the stock has underperformed and the valuation has normalized, the buyback engine is being restarted. In late 2025, the company completed over 90% of its massive share repurchase program and recently hiked its dividend by 20%, its first major increase in five years.
On the flip side, CN Rail can’t go as aggressively, as it spent a ton of its money a few years ago. This highlights how key a management team is to a company’s success. You often don’t see it over a period of 6 months or a year. But over half a decade? It can be especially noticeable.
CPKC remains a Foundational Stock choice because it offers a growth profile that is unmatched in the rail industry. They are on track to achieve $1 billion in annual synergies by the end of this year, and their debt-to-EBITDA ratio has already been successfully driven back down toward their 2.5x target.
You are essentially getting the efficiency of a Class-1 railroad with the growth potential of an emerging market play. At 2026 valuations, the uncertainty of the merger is gone, replaced by the reality of a dominant, cross-border monopoly. I expect CPKC to lead the rail rebound and finally break the three-year streak of underperformance.
- The North American economies. Canada, the United States, and Mexico’s economies are critical to CPKC’s sales and earnings growth. It is now the only railway that spans all 3 countries. Although it will benefit from all 3 firing on all cylinders, it will also be weaker if all 3 are struggling, which is often the case due to how much they interact with each other.
- Share repurchases. Now that CP’s old NCIB is nearly complete, look for management to announce an even larger repurchase program for late 2026. This would signal that they believe the stock is still undervalued relative to the long-term cash flow potential of the business. Timing is everything, and cash deployed now is likely to be much more beneficial than cash deployed in 21/22.
- Tariffs. Because the company operates across all 3 countries, it is potentially going to be impacted by Trump’s tariffs. If tariffs are put in place, this could discourage US companies from purchasing goods internationally, which would ultimately impact freight volumes.
- Operating ratios. The operating ratio is an important ratio for railways. It highlights how much the company has to spend in order to earn its revenue (the lower, the better). Management has been laser-focused on bringing the core operating ratio toward the 50s. In 2026, as the KCS integration is fully finalized, any significant drop in the OR will lead to outsized EPS beats.
There are two main KPIs for a railway. Revenue Ton Miles (RTM), and overall Carloads. These KPIs give us an idea of not only demand, but operational efficiency (more so with RTM in this regard).

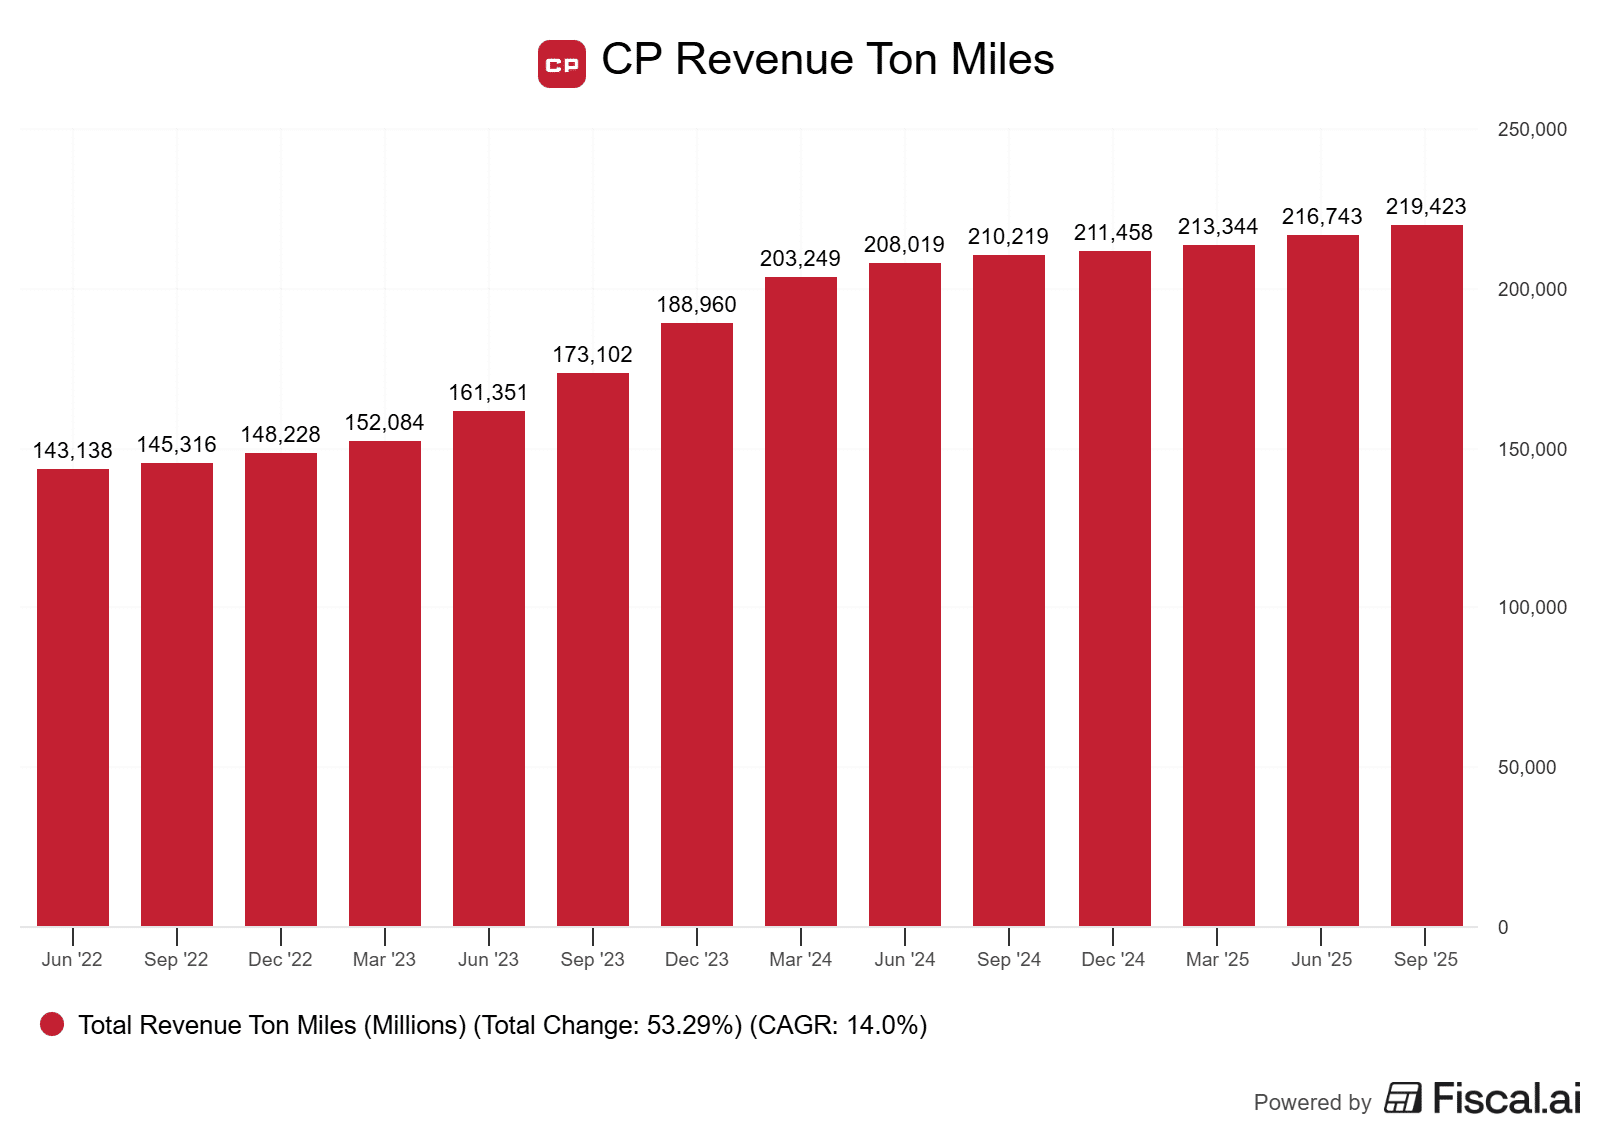
January 30, 2026 – It was a quarter where CPKC proved that even if the macro environment is terrible, you can still put up some solid operational results. Revenue growth was essentially flat at 1% for the quarter and earnings increased by 3.3%, but the real story is in the margins.
The company produced a record core adjusted operating ratio of 55.9%, which is basically the gold standard for the industry right now. In my opinion, CP Rail is the best operated railway in North America, and it’s not even close.
If you look at the segments, it is a bit of a mixed bag. Grain is the star here, benefiting from a record harvest that is going to provide a massive tailwind well into 2026. On the flip side, you have forest products taking a double-digit hit from lumber tariffs and automotive struggling with supply chain kinks. When your business touches virtually ever end of the economy, “mixed bag” is fairly common. Right now, more areas are being negatively impacted than positively, but this simply cannot last forever.
And make no mistake, the long-term thesis for the Kansas City Southern merger is still very much intact. Intermodal growth through the MMX service is booming, up 40%, and management is confident enough in their cash flow and stock valuation to launch a new 5% share buyback program. Remember, I have been adamant about CN Rail wasting money on buybacks during the 2022/2023 period of high valuations. What we are seeing now is low, single-digit dividend raises and a small amount of buybacks from CN Rail.
Meanwhile, CP has put itself in a situation where they can ramp up both dividend growth and buybacks.
The company is also cutting capital expenditures by 15% next year, which shows they have moved past the heavy lifting phase of the integration and are now focused on harvesting the synergies from it.
For shareholders, the takeaway is clear. The network is running faster and more efficiently than ever. While the market might fret over a tiny revenue miss, as long term shareholders we can ignore this noise and focus on the underlying engine of this business, which is firing on all cylinders.
While institutions chase absolute returns, we can quietly accumulate compounders at lower prices. Yes, we may pass up a bit of returns right now. However, if our time horizon is long, this shouldn’t matter.
TMX Group (TSE:X)
TMX Group Ltd. engages in operating global markets and builds digital communities and analytic solutions that facilitate the funding of businesses, traders, and investors. It operates through the following segments: Capital Formation, Equities and Fixed Income Trading and Clearing, Derivatives Trading and Clearing, and Global Solutions, Insights and Analytics. The Capital Formation segment includes the Toronto Stock Exchange, TSX Venture Exchange, and TSX Trust. The Equities and Fixed Income Trading and Clearing segment involves the operation of Alpha Exchange and Clearing and Depository Services Inc. The Derivatives Trading and Clearing segment focuses on the Montreal Exchange and Canadian Derivatives Clearing Corporation (CDCC). The Global Solutions, Insights and Analytics segment consists of TMX Datalinx, Co-Location, and Trayport.
After 3+ years on the Bull List, graduating TMX Group to the Foundational Stocks List seemed like a no-brainer. After all, this company’s moat is wide, and it is currently utilizing this moat to acquire and merge new data solutions into the fold. Make no mistake about it, this is not a pure-play on market exchange anymore. It is much more than that.
Historically, TMX was a volume play. If Canadians weren’t trading, the stock didn’t move. Today, TMX has decoupled its growth from the daily fluctuations of the TSX through a massive expansion into data, derivatives, and international markets.
The most noticeable shift is the company’s “TM2X” strategy, which has turned TMX into a diversified tech platform. By the start of 2026, over 50% of TMX’s revenue will be generated outside of Canada, and more than 67% of that revenue is recurring. If you were to have looked at this company even 4-5 years ago, the situation was much different.
TMX’s operating margins of ~29% are closer to “Big Tech” than traditional finance. They have successfully modernized their back-end clearing systems (the PTM project), which management expects will hit full “run-rate” savings in 2026, further expanding margins.
This is a Canadian cliché, but I have to say it. TMX is skating to where the puck is going, not to where the puck has been.
The core of the “new” TMX is its Global Insights segment, which has gone from a side gig to the primary growth engine of the company. Through the integration of VettaFi (indexing and ETFs) and Trayport (data for energy trading), TMX has transitioned to a subscription-based company.
Trayport is the dominant network for European energy trading. Despite the volatility in energy prices, Trayport has consistently delivered mid-to-high double-digit recurring revenue growth because traders need the platform’s analytics to navigate that volatility.
In addition to this, by owning the indexing and digital distribution for the ETF industry, TMX is profiting from the massive migration of capital from active mutual funds into ETFs. In 2025, TMX saw a record 200+ new ETF listings, surpassing the previous year’s record.
While the data business is the main growth engine, we can’t forget that this company still owns the largest exchanges in the country. TMX has built a massive derivative business through the Montréal Exchange. Every new contract traded on the Montréal Exchange carries almost zero incremental cost but falls straight to the bottom line.
Despite aggressive acquisitions, TMX maintains a payout ratio in terms of earnings of around 45%. This leaves plenty of dry powder to continue buying smaller high-margin data firms, all while continuing to reward shareholders with a growing dividend.
Ultimately, TMX Group offers the best of both worlds. It provides the defensive stability of a utility, the growth profile of a SaaS company, and the reliability of a Canadian Dividend Aristocrat with a decade-long dividend growth streak.
- Recurring revenue mix. Continued expansion of TMX’s Global Solutions, Insights, and Analytics segment is one of the most important KPIs. It reflects high-margin, subscription-based revenue from platforms like VettaFi and Trayport. In 2026, we are looking for this segment to climb toward 50% of total revenue. Right now, that is around 41%.
- IPO & listing platform. After a multi-year drought caused by high policy rates, the trend for 2026 is the listing market. With interest rates stabilizing, we need to watch the volume of new equity raises on the TSX. While the TSX Venture has been propped up by critical minerals and mining, a truly healthy foundational thesis requires a broader recovery in tech and industrial IPOs.
- Derivatives activity. Data revenue aside, derivatives are currently the fastest growth engine in TMX’s traditional business. In a volatile 2026 macro environment, institutional investors are increasingly using derivatives to hedge interest rate and equity risk. Open interest hit record highs last year, and the operational leverage can be immense, as these trades carry almost zero incremental cost to process but contribute significantly to the bottom line.
- Continued acquisitions. TMX is now an aggressive acquirer. The trend for 2026 is the integration and cross-selling of Verity and other recent data acquisitions. I want to see if management can successfully sell these new research and analytics tools to their existing base of clients. TMX has a goal of reaching $2 billion in annual revenue by the late 2020s. They will need more mergers and acquisitions to do so.
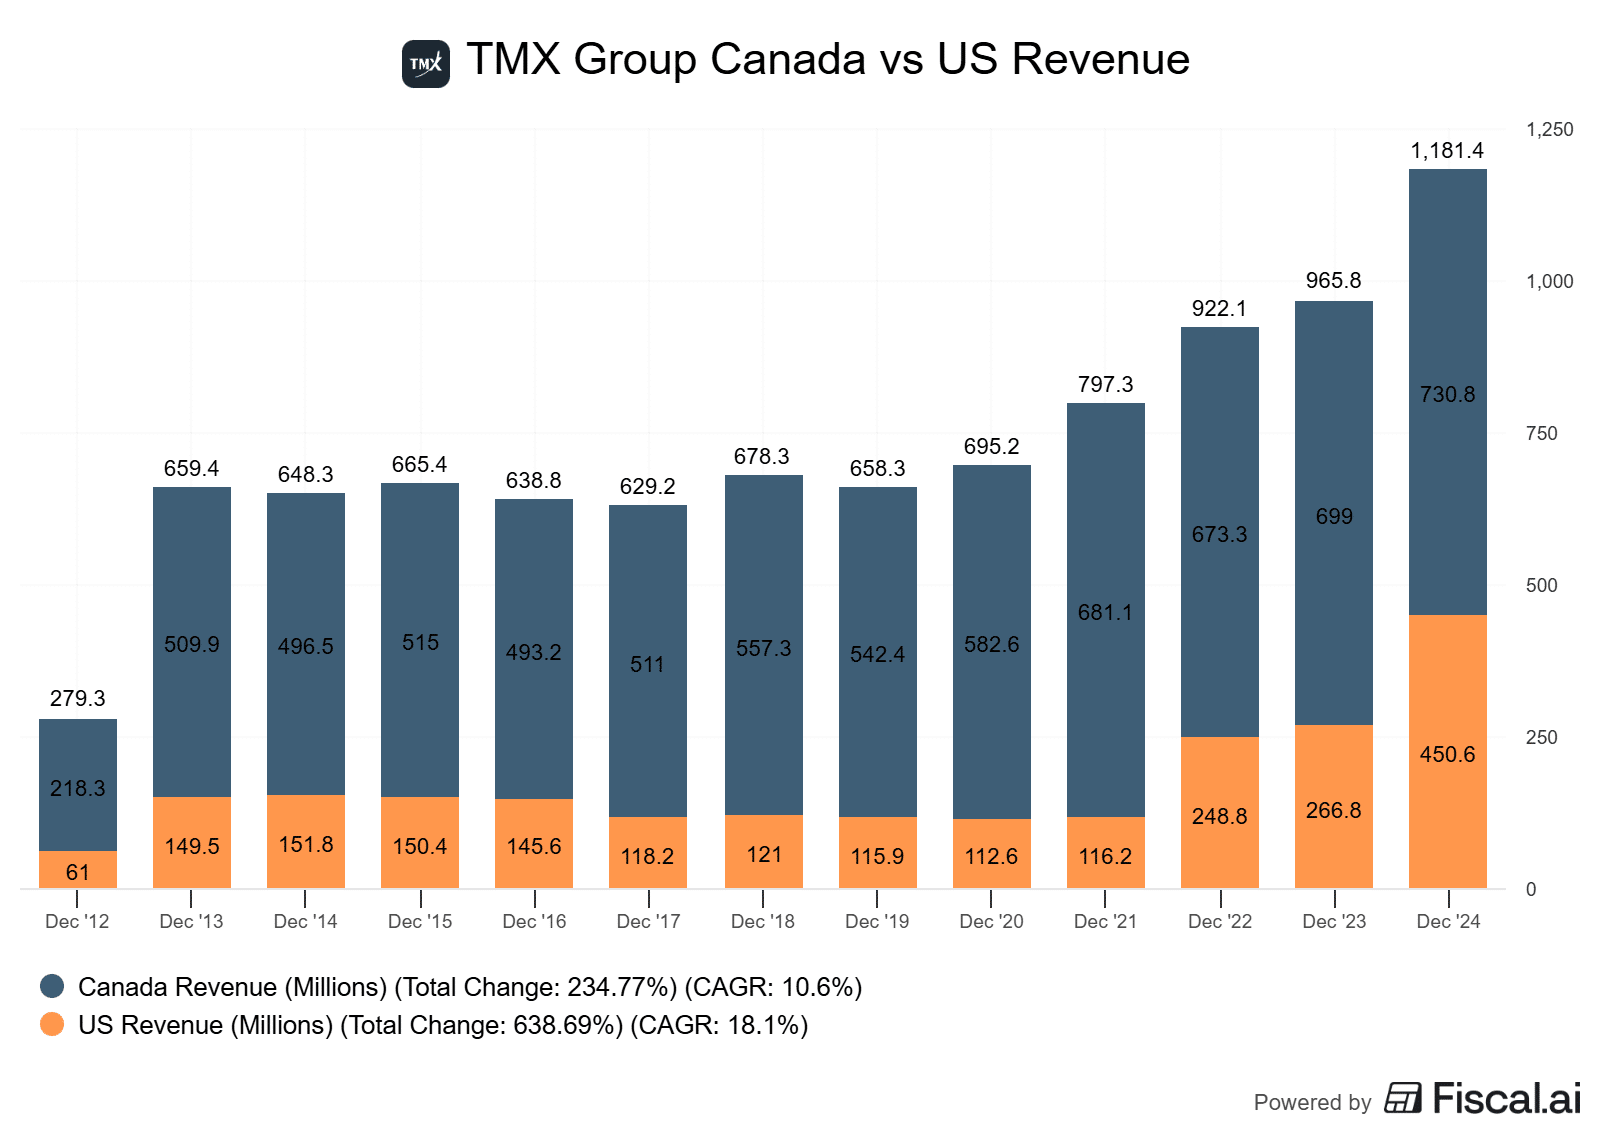
Revenue by segment is an essential KPI for TMX Group because it provides a view of the company’s aggressive and successful pivot from a volume-sensitive exchange to a high-margin technology and information provider. By looking at the growth of the Global Solutions, Insights, and Analytics segment, investors can see the tangible results of the “TM2X” strategy, where recurring, subscription-based revenue from platforms like VettaFi and Trayport is replacing the more volatile, transaction-based fees of the traditional trading floor. The second is the company’s growth in the US, which, as you can see by the chart, is far outpacing Canada. This makes sense, as its position is more dominant in Canada. There is more runway in the US.
February 6, 2026 – TMX Group reported record fourth-quarter revenue of $457.8 million. This is a 16% increase in revenue, while earnings increased by 22%. While reported net income was weighed down by non-cash charges and some one-time audit charges, the underlying business demonstrated it is growing at an outstanding pace, with organic revenue growing 13%. The best part? Expenses only grew by 6%.
Growth was driven largely by the Global Insights segment, where VettaFi assets under management reached $77 billion, and the Derivatives segment, which saw a 27% revenue jump. As I’ve mentioned numerous times before, we’re in a heightened market of speculation. When this happens, options activity and other derivatives will see high activity. The strength in derivatives, highlighted by a 33% increase in open interest, suggests that institutional hedging demand remains a fairly strong tailwind.
Although IPO activity remained quiet, as it has for a few years on the Canadian markets, secondary financing transactions increased by 53%, particularly within the mining sector. Remember, these miners are trading at high valuations. If they can, issuing equity at high prices is beneficial.
The company is currently benefiting from the transition toward high-margin, recurring data revenue, which reduces its reliance on trading activity on the TSX. This is precisely why you see the company’s valuation expanding. It is being valued as a recurring revenue software business now, not a cyclical market company.
Global Insights (this is the higher margin segment) now accounts for roughly 40% of total revenue. I would not be shocked if it surpasses 50%~ over the next few years here, improving the margin profile. The company is also reporting it is successfully using AI and automated research tools through its Verity and Trayport platforms. What this is doing is ramping up their output, which ultimately adds sales, all while reducing the time it takes to increase that output.
For guidance in 2026, management has indicated it has the deepest IPO pipeline in several years, characterized by a resurgence in interest from technology firms and several companies graduating from the venture exchange. In 2025, 11 companies transitioned from the TSX Venture to the TSX, including 10 mining firms like Southern Cross Gold and Alkane Resources.
The continued dominance of the mining sector, while a concentration risk on the company’s results no doubt, served as pretty much the primary market in 2026, with precious metals prices bringing in nearly $29 billion in total equity capital raised across TMX’s exchanges.
It was an outstanding quarter, and despite this, the stock trades near 52-week lows. A good time to add, in my opinion.
Franco-Nevada Corp (FNV.TO)

Franco-Nevada Corp is a precious-metals-focused royalty and investment company. The company owns a diversified portfolio of precious metals and royalty streams, which is actively managed to generate the bulk of its revenue from gold, silver, and platinum. The company does not operate mines, develop projects, or conduct exploration. Franco-Nevada’s short-term financial performance is linked to the price of commodities and the amount of production from its portfolio of producing assets. Its long-term performance is affected by the availability of exploration and development capital. The company holds a portfolio of assets, diversified by commodity, revenue type, and stage of project, primarily located in the US, Canada, and Australia.
As we head into 2026, the case for Franco-Nevada has shifted from a story of weathering the storm to one of sizable potential due to gold prices. My conviction that Franco remains the premier material play on the TSX is stronger than ever. The logic is simple.
We are in a structural bull market for gold. While most investors chase volatile producers with variable capital costs, Franco-Nevada offers the cleanest, most efficient access to that upside without the operational headaches. Sure, a person won’t win the lottery on a company like Franco as they might hope to with a junior miner. But you won’t lose your shirt either.
The streaming model is the ultimate cheat code in a volatile market, in my opinion. By providing upfront capital in exchange for the right to buy gold at a fixed, massive discount, Franco effectively fixes its cost of goods sold. This creates a high-margin business that is almost immune to the labor and fuel inflation that eventually craters a lot of traditional miners.
This isn’t just my theory, either. It’s historically proven. During the last major gold bear market (2011–2021), many major gold producers saw their stock prices slashed by 40% or more as they struggled with debt and falling margins. -40% returns over a ten year timeframe.
In that same window, Franco-Nevada nearly tripled in price.
That is the power of the royalty model. It offers reasonable exposure to the upside of gold, with the floor of a high-quality institution.
The primary cloud over Franco has been the closure of the Cobre Panama mine, which led to a $1 billion impairment in recent years. However, the narrative is shifting significantly as we enter 2026. Panama’s new President, José Raúl Mulino, has publicly acknowledged the mine’s critical role, contributing 5% to the country’s GDP, and has begun a formal environmental audit as a precursor to reopening talks.
While my thesis doesn’t require Cobre Panama to restart, it is increasingly likely that it will. Arbitration hearings are currently scheduled for October 2026, but the market is starting to price-in a negotiated settlement long before then. If even a partial restart is announced, Franco-Nevada has about 175,000 gold equivalent ounces (GEOs) of “hidden” annual production that would instantly hit the bottom line.
In an industry where balance sheets are usually stretched, Franco-Nevada is the complete opposite. The company is debt-free and sits on a significant cash pile. This liquidity allows them to be the lender of choice for the next generation of mines. While others are struggling to fund projects at 2026 interest rates, Franco can swoop in and secure streaming contracts, such as their recent $1.1 billion move into the Cote Gold mine.
If you want to play the gold bull market, you can gamble on a miner and hope their trucks don’t break, gas prices don’t launch, or their labor doesn’t strike. Or, you can own Franco-Nevada, the company that gets paid first, has no debt, and is currently trading at a valuation that doesn’t yet fully account for its largest asset potentially coming back online.
- Price of precious metals and fossil fuels. For the most part, you’re going to want to keep an eye on the price of gold with Franco Nevada. However, Franco Nevada is a rare streamer that also has exposure to oil, natural gas, and NGLs. The higher these commodities go, the more Franco Nevada will benefit. All while not having to realize high operating costs.
- Acquisition pace. In an environment where traditional project financing is expensive for miners, Franco is the ultimate lender. They have recently added significant royalties such as the Arthur deposit and the Côté Gold mine, which are just now starting to ramp up production. Look for management to use their $1.3 billion in cash flow to buy the dip on high-quality projects.
- The Cobre Panama situation. The Panamanian government’s environmental audit has concluded, and President Mulino’s administration is now in formal negotiations with First Quantum. The trend to follow isn’t just “if” it reopens, but the structure of the deal. Any announcement regarding a phased restart would instantly unlock Franco’s stalled production of ~175,000 gold equivalent ounces (GEOs) and potentially trigger a valuation re-rating.
- Macro-economic indicators. Ultimately, gold prices are influenced heavily by macro factors like inflation, interest rates, currency fluctuations, and global conflicts. The more uncertainty there is in the world, the higher the price of gold should go.
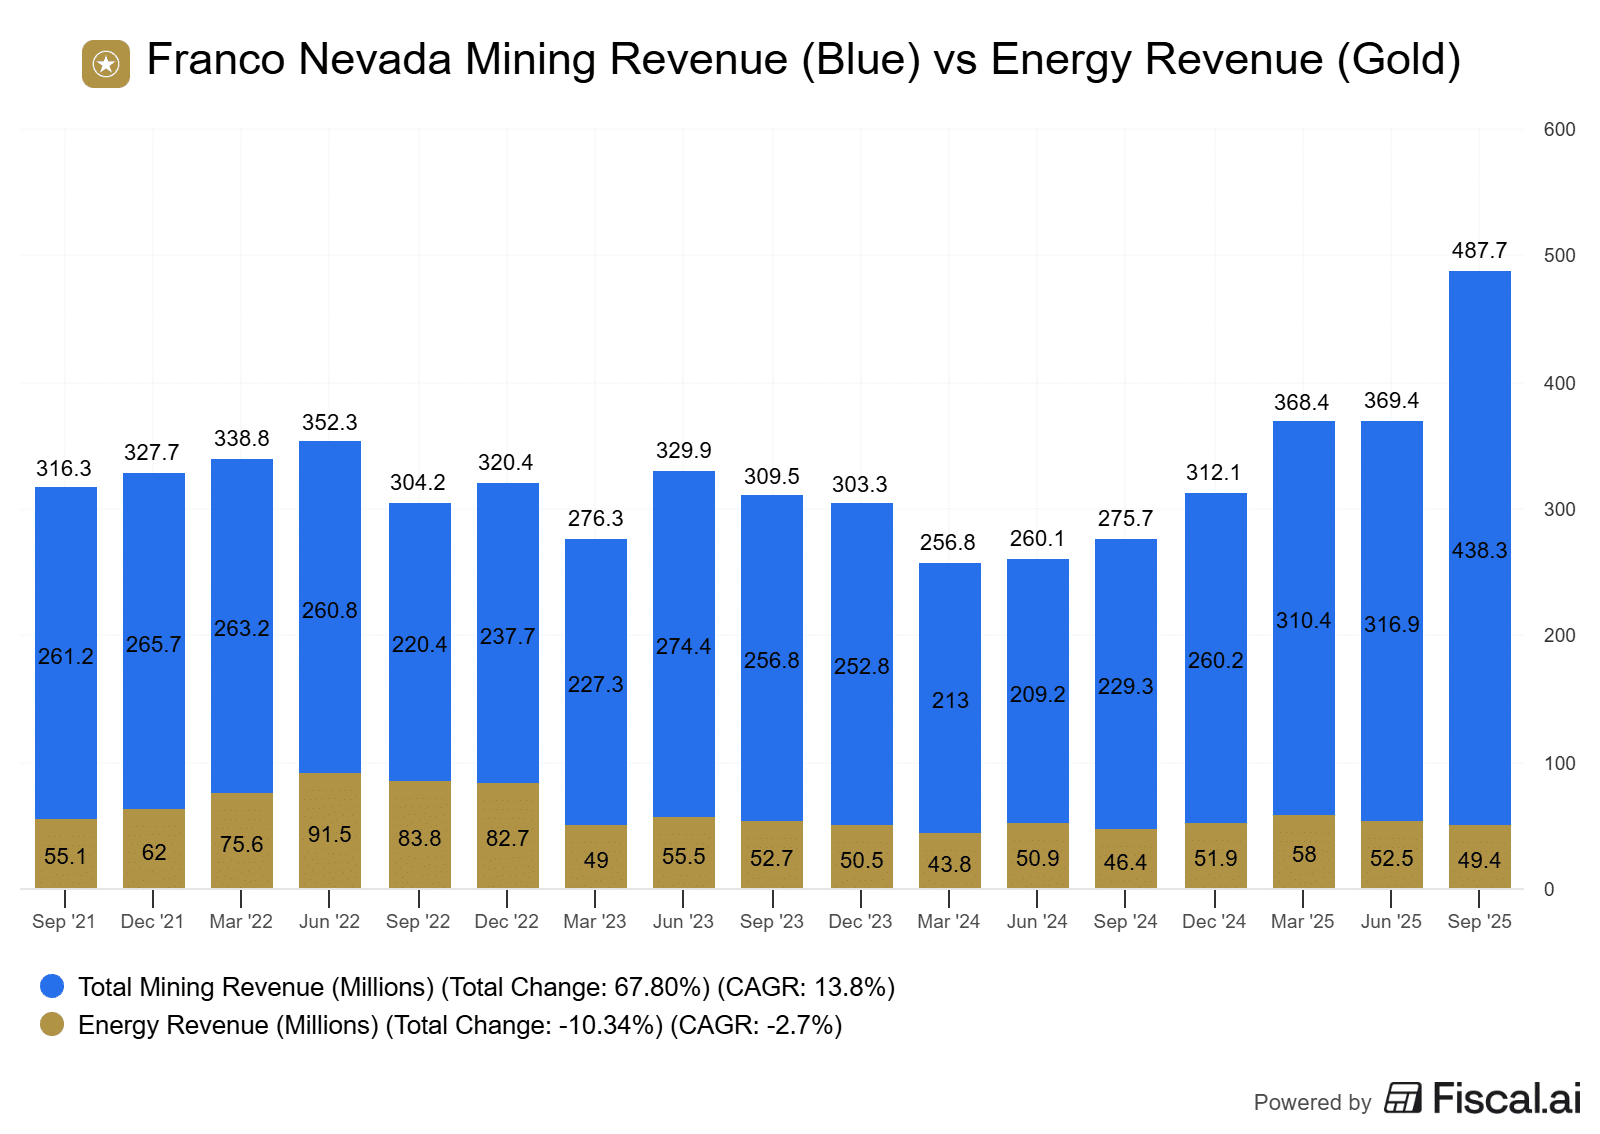
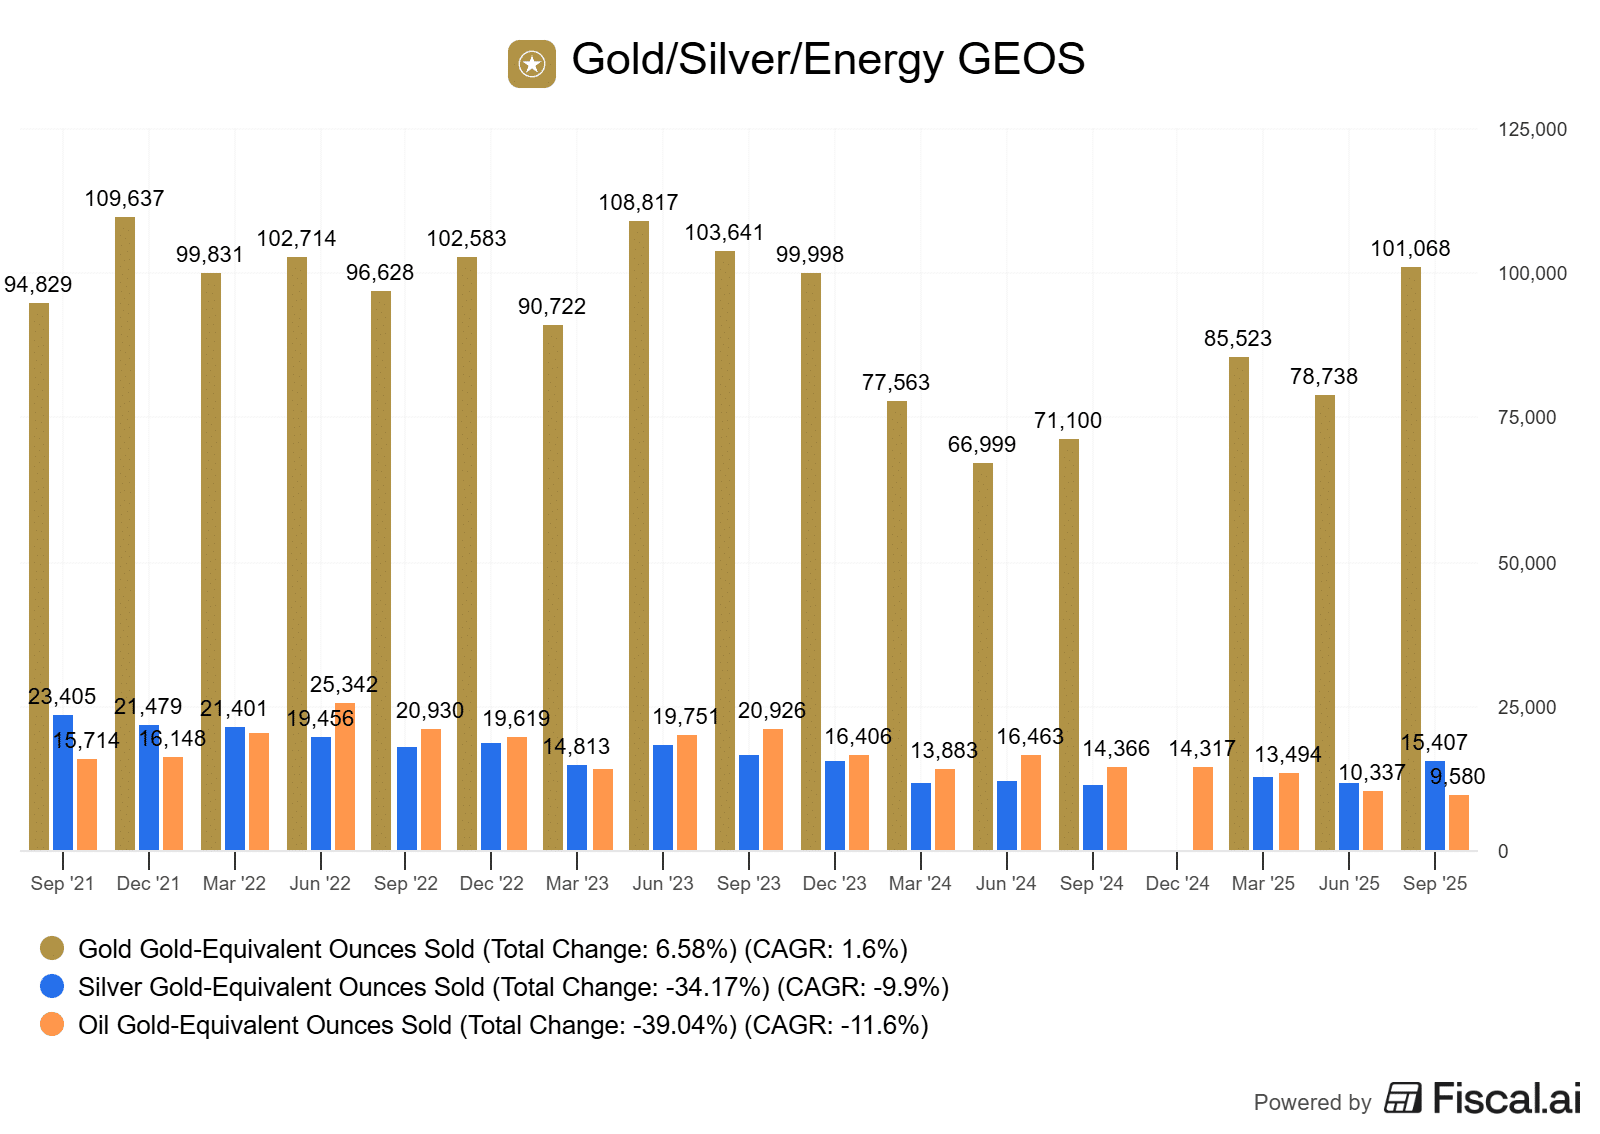
The main key performance indicators behind Franco Nevada are gold equivalent ounces sold (GEOS). It measures its royalties on all products equivalent to an ounce of gold sold in order to make its business easier to understand. Yes, it seems confusing to compare an oil royalty to an ounce of gold, but it makes sense when you’re comparing apples to apples. Ultimately, we want to see these go up. However, with the impacts to the oil and gas industry and the impact regarding Cobre Panama, they’re trending downward.
In addition to this, you’ll notice for gold and silver GEOS, I only have a KPI up to December of last year. This is because they ended that KPI and started a new “ex-Cobre Panama” KPI. I will update the chart midway through the year when I have more data.
November 4, 2025 – Franco-Nevada’s third quarter was massive. Record revenue, record profitability, and a debt-free balance sheet back in place.
Revenue came in at $487.7M, up 77% year-over-year (YoY) with adjusted EBITDA coming in at $427.3M (87.6% margin) and adjusted earnings at $1.43, both topping expectations. Gold Equivalent ounces (GEO) sold were 138,772.
Precious metals were 85% of revenue (72% gold, 11% silver, 2% Platinum Group), and the mix improved because gold outperformed everything else. Incremental volumes and first-time contributions from Côté Gold, Western Limb, and Porcupine, plus stronger deliveries from Guadalupe-Palmarejo and Tocantinzinho drove performance, and kind of highlight the flexibility that Franco has right now with zero debt and over $1B+ in liquidity. It can continually make deals that add incremental value to the company.
Guidance is moving in the direction that I like. The company now expects to exceed its initial precious-metals GEO outlook, and it narrowed total GEOs toward the high end of its guidance. Revised 2025 ranges are 420–440k for precious-metals GEOs (up from 385–425k) and 495–525k for total GEOs (tightened from 465–525k). So not only have they tightened up the bottom end of their guidance, they’ve even bumped the top end for precious metal GEOs.
On Cobre Panama, which is a very important topic when it comes to Franco Nevada, it is clear the tone has shifted from what the company is going to do after it closes down to practical restart steps. First Quantum (the owner of Cobre Panama) has begun pre-commissioning the on-site power plant, and Panama’s Environment Ministry kicked off an audit in October that will span a wide variety of areas that are critical to getting the mine back up and running.
Obviously there is still risks and potential slipups here, especially when we look to the political side, but the fact this is even a consideration now is a huge bonus. A year ago, they had pretty much written off any chance of the mine restarting. We do have to remember, Cobre Panama made up 20% of Franco Nevada’s EBITDA at the time of shutdown. This not a small project, and would be a material boost to results.
After briefly drawing down on its line of credit in July for the Arthur Gold royalty, the company repaid it and finished the quarter debt-free again, with $236.7M of cash and the full $1B line of credit available to deploy. The company’s tendency to eliminate debt as quick as possible is not all that surprising. It is a strategy Franco has utilized for a long time, just because of the nature of the business. It needs liquidity in order to make deals.
Overall, price tailwinds are obvious, and will be reflected in Franco’s price almost right away. It is not surprising that the company is growing at the pace of a small cap tech stock considering gold prices. However, under the surface, where you have to dig a bit deeper, it starts to look really nice. New assets are starting to show up in the company’s results, and the bump in guidance is a quiet sign that management sees more precious-metals volume ahead than it planned for in January.
If Cobre Panamá keeps ticking boxes, before we know it this mine will be up and running again and contributing meaningfully to Franco’s results. Liquidity should allow it to continue making outstanding deals that will contribute to the bottom line, and when the price of oil and natural gas pick back up, they should stop being a large drag on the business.
Constellation Software Inc (CSU.TO)

Constellation Software Inc., together with its subsidiaries, acquires, builds, and manages vertical-market software businesses in Canada, the United States, the United Kingdom, and the rest of Europe. Its industry-specific software businesses provide specialized and mission-critical software solutions. The company serves public and private sector markets. Constellation Software Inc. was incorporated in 1995 and is headquartered in Toronto, Canada.
Constellation Software remains the gold standard for capital allocation in the Canadian tech landscape. However, 2026 finds the company at a crossroads. Why am I keeping it on the Foundational Stocks List? Primarily because I believe there is a good chance it will choose the right road to head down.
The strategy itself is unchanged. The firm continues to acquire small, under-the-radar vertical-market software (VMS) companies that dominate their respective niches. These businesses are inherently “sticky” because they are the operational backbone of their respective industries. However, the narrative around the stock has shifted significantly over the last six months due to two major developments: the perceived threat of artificial intelligence and the retirement of legendary founder Mark Leonard.
Late in 2025, Mark Leonard resigned as President for health reasons, marking the end of the “founder-led” era for Constellation. While Mark Miller, a 30-year veteran and former COO, has stepped into the role, the market initially reacted with a psychological sell-off.
For decades, Leonard was seen as the sole architect of the machine. However, the beauty of Constellation is that it has always been a decentralized organization. The “manual” for how to buy and manage VMS companies has been spread across hundreds of operating units. This is not a one-man show, not even close.
The second major headwind is the fear that AI will disrupt VMS software by lowering the barriers to entry for new competitors or by allowing customers to build their own custom agents. This disruption narrative brought the valuation down to levels we haven’t seen in years, with the stock recently trading around 20x free cash flow as of the start of 2026, a massive discount compared to its 45x peak in early 2025.
In my view, the market is misspricing this risk. While AI might allow a competitor to write code faster, it cannot replicate the deep expertise, proprietary data, and decades of customer relationships that Constellation’s companies have developed. In addition to this, it cannot debug code effectively enough for people to risk going on their own.
In my opinion, AI is more likely to become a tailwind. By integrating AI into their existing, “sticky” platforms, Constellation can actually increase switching costs and offer new, high-margin features to customers. They are already reporting that 27% of their business units are developing AI-powered products, and 61% are using AI to make their R&D more efficient. Rather than destroying the moat, AI is allowing the company to process more data and serve customers more effectively. I would be shocked if you didn’t see AI eventually lower operational costs and improve margins.
Despite being a near ~$80B giant, the runway for growth through acquisitions and spinoffs like Topicus and Lumine remains long. The company is finding more businesses to acquire, not fewer, and their recent results show free cash flow available to shareholders growing at over 25%. With the “founder premium” gone and the AI fear priced in, Constellation is much cheaper today than it was six months ago. It remains the best blue-chip technology company in the country.
- Artificial intelligence. I feel this one is obvious. The company needs to turn AI into a tailwind to get rid of the current fears. If their VMS tools can start adding value for customers, like automating inventory reorders or hospital staffing, to name a couple, the stickiness of the software increases, and the cost of that software goes up.
- Pace of acquisitions. Constellation Software relies almost exclusively on acquisitions. Yes, there is organic growth there, but not nearly enough to justify the high valuations. The company needs to continually identify and acquire new companies in order to maintain its pace of free cash flow growth.
- Post-founder results. Last year, one of the must-follow trends in this section was management changes causing volatility. With Mark Miller at the helm, we must watch for any signs of cultural drift. The key metric here is the hurdle rate. As long as Constellation maintains its disciplined 20%+ internal rate of return (IRR) requirements for new deals, there isn’t much to worry about. If this starts to slip, we need to look for why.
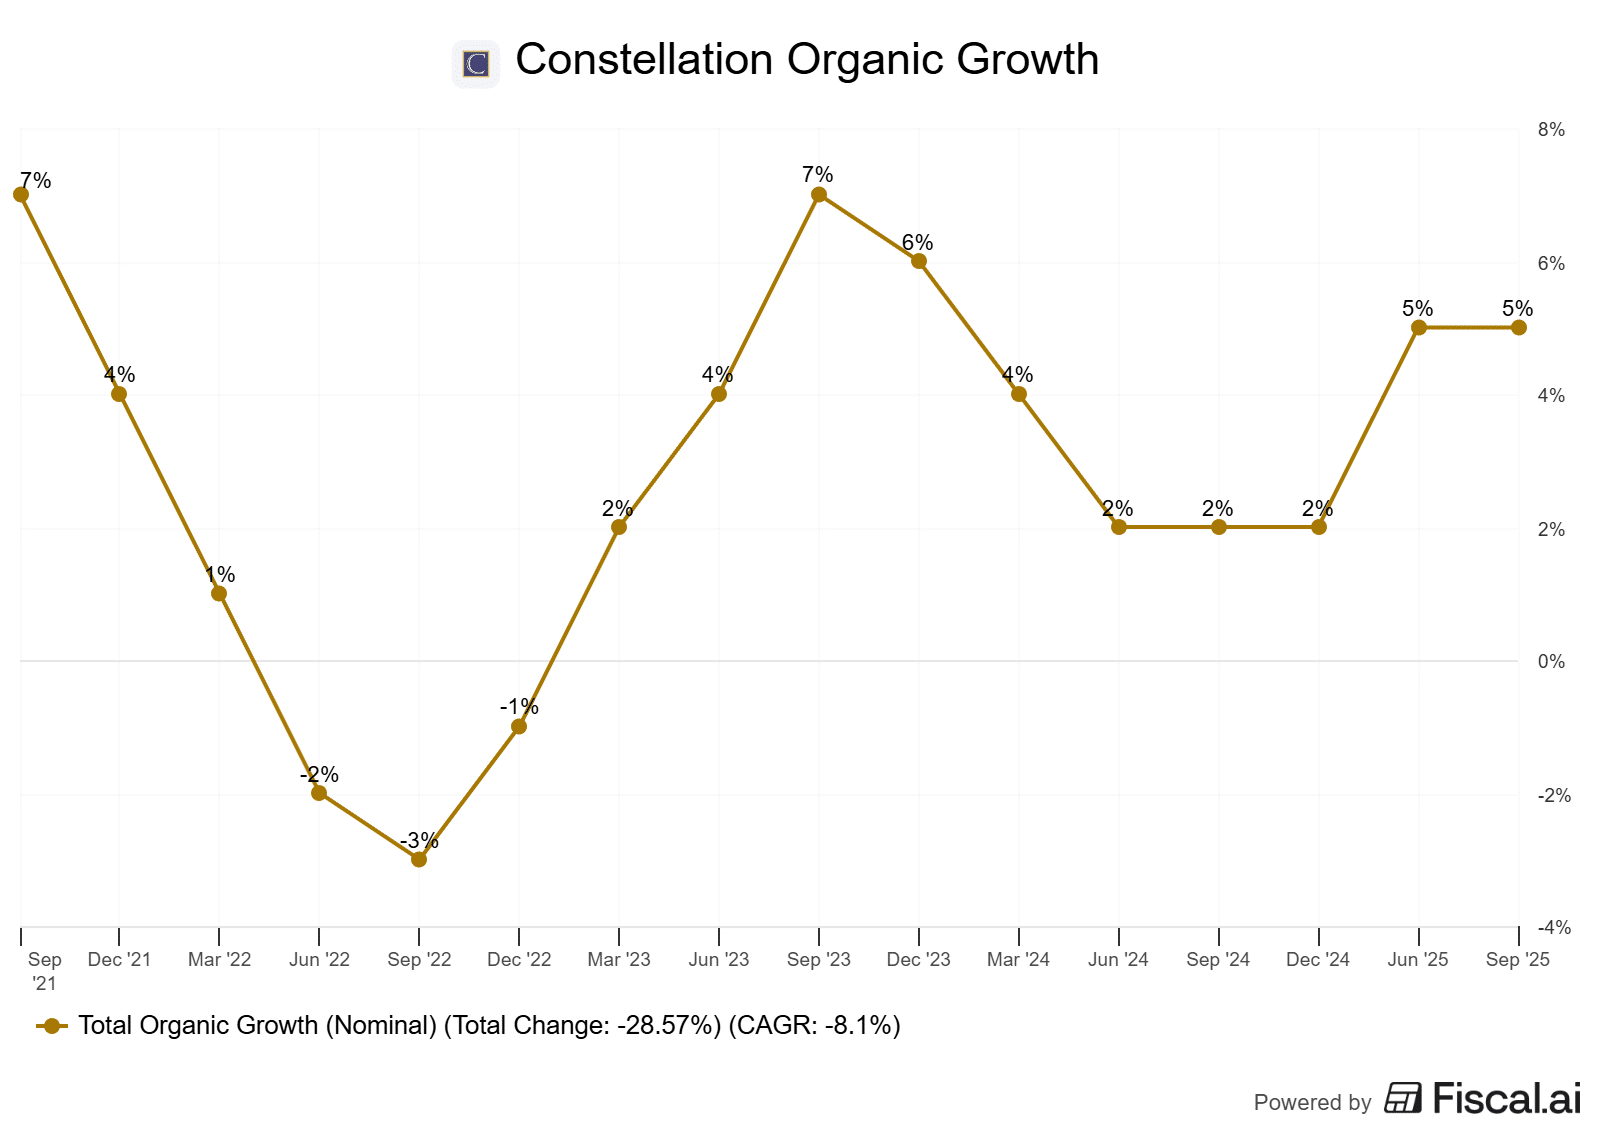
- Organic growth. Constellation relies heavily on acquisitions. Because of this, it only grows organically by anywhere from 4-5%. If the company can increase this, it is likely doing so by utilizing AI tools to trim operational costs and potentially charging customers for added functionality.
There are 3 main KPIs to follow when it comes to Constellation. The first is Free Cash Flow Available to Shareholders, or FCFA2S. So why this and not just normal free cash flow? Because Constellation has spinoffs and partially owned subsidiaries (like Topicus and Lumine). A portion of the total cash flow actually belongs to the minority shareholders of those companies. By using the A2S, you get a more accurate representation of Constellation’s free cash flows.
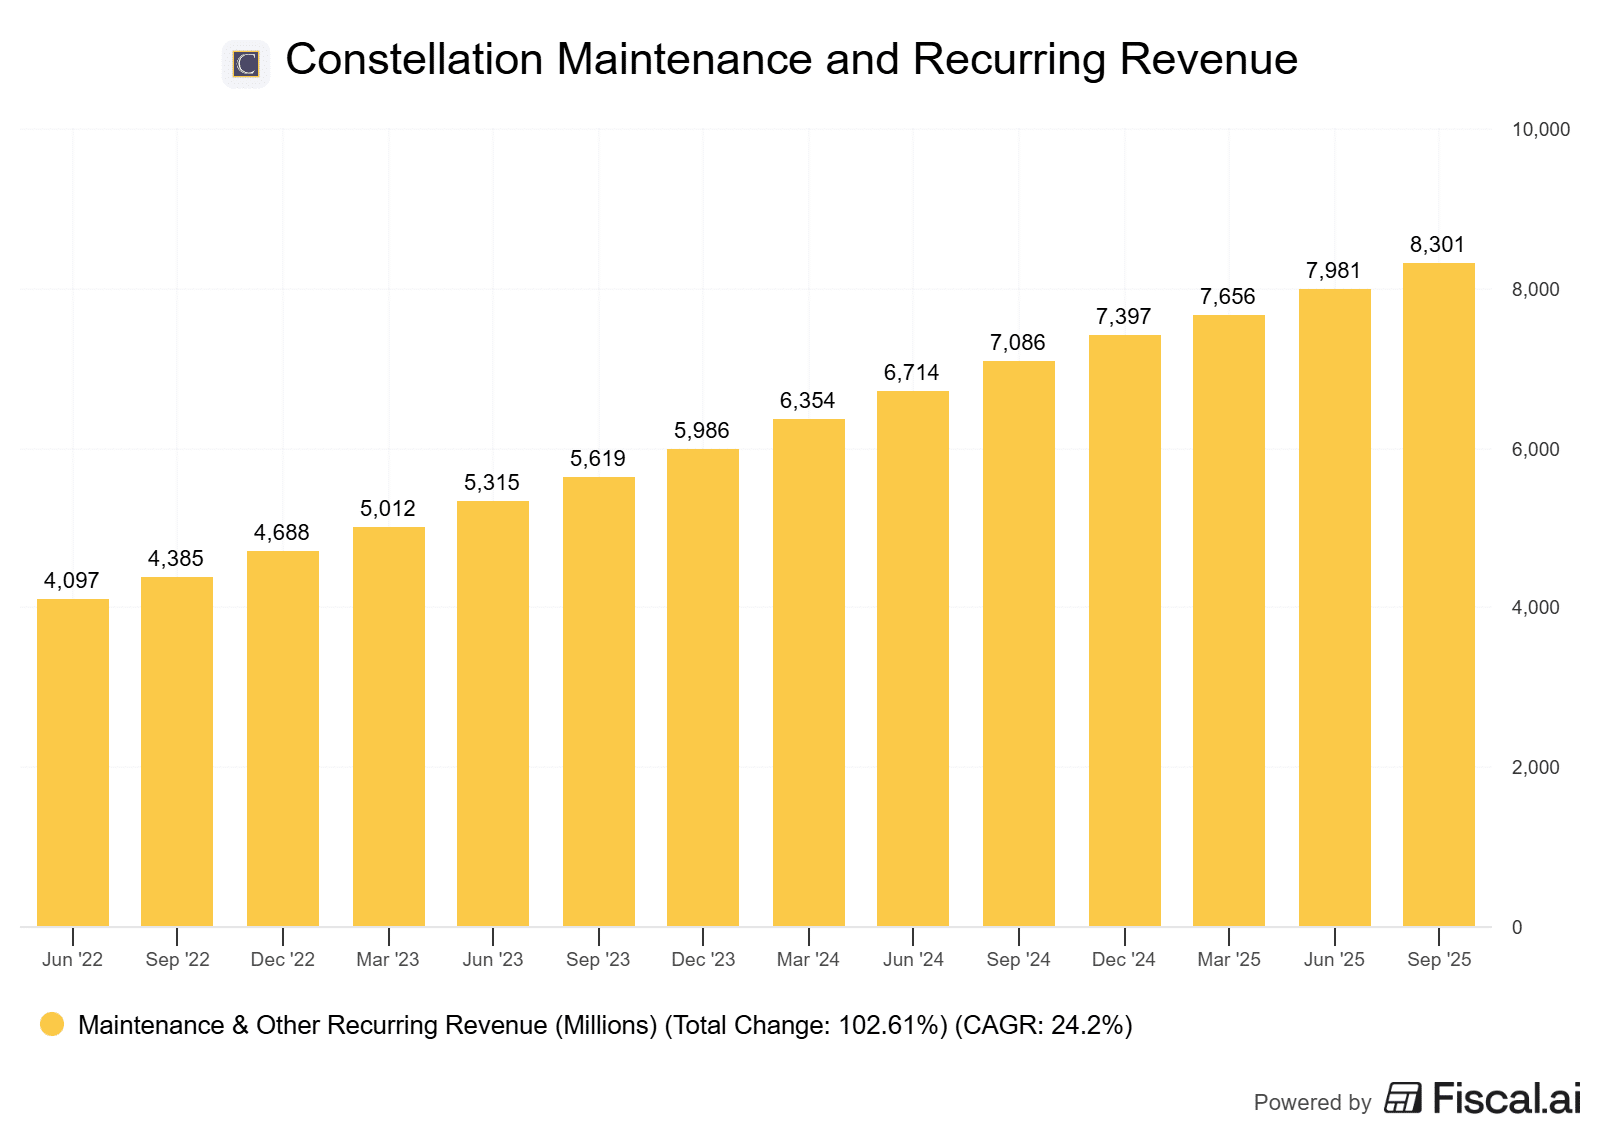
The second KPI is maintenance and recurring revenue. This is the bread and butter of business operations, making up over 75% of revenue. This is the number one revenue stream you want to be following with CSU.
And finally, we have organic growth rates. Constellation acquires slower-growing companies with high switching costs and strong rates of renewal. So, organic growth will never be high, but typically hovers in the 3-5% range.
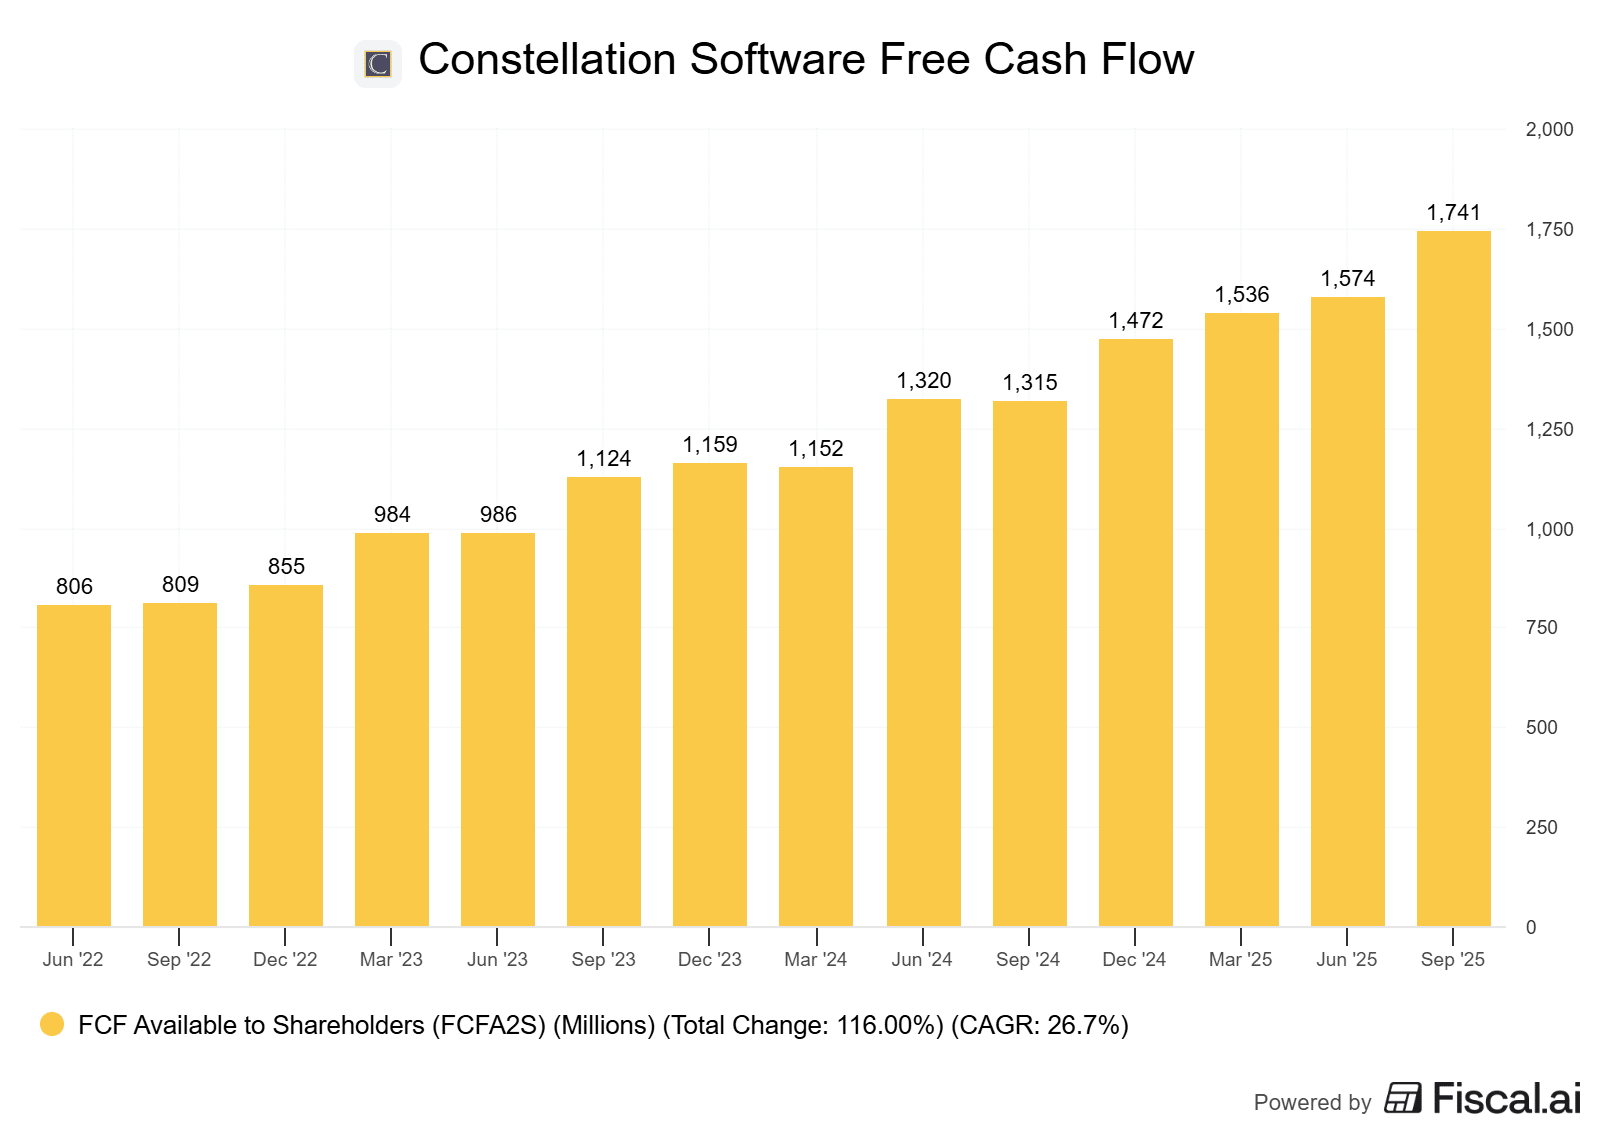
November 8, 2025 – Constellation Software, at least thus far, has shown zero indication that AI is going to be a headwind for the business. Revenue increased 16% year over year and free cash flow to shareholders increased by 46%. This was the largest quarter in the company’s history when it comes to free cash flow generation.
The results reflect what Constellation does best, which is acquire, integrate, and scale vertical-market software businesses with surgical precision.
Organic growth came in at 5% for the quarter, and only 3% for the year to date when adjusted for foreign exchange. These are certainly lower levels of organic growth than we’re used to. However, it is also only a single quarter, and I’m going going to draw any conclusions from it.
Recurring revenue climbed 17% and continues to account for more than 75% of the company’s revenue. License and hardware sales also posted healthy gains, though they remain small contributors to the overall revenue mix. Make no mistake about it, recurring revenue is what you want to see trending upwards here. Growth in the other segments is nice, but recurring is what moves the needle.
On the expense side, costs were well managed, rising 14% against 16% revenue growth. This is in contrast to its spinoff, Topicus, which reported larger expenses than revenue growth.
Earnings jumped to $9.89, but the year-to-date figure of $18.96 is down from $21.04 a year ago. For a company as acquisition heavy and accounting-complex as Constellation, these earnings figures will confuse you more than they’ll help. Free cash flow is what you want to focus on.
Free cash flow available to shareholders rose to $529 million, up nearly 50% from last year, and operating cash flow crossed $685 million. As mentioned, this was the highest quarter of free cash flow generation for the company in its history, and despite taking a 30%+ hit to its share price over the last while, is not showing any sort of headwinds in its results.
Constellation deployed $281 million in cash on acquisitions, with total consideration including earnouts and deferrals sitting at $415 million. This pace isn’t record-breaking, they’ve certainly had much bigger quarters. But it’s consistent with their measured, long-game approach. The pipeline appears healthy, and management shows no sign of abandoning their disciplined acquisition strategy despite a very tough market.
The main benefit of potential AI headwinds is the fact that it could very well bring down valuation multiples for vertical market software companies, which could be a large tailwind for Constellation.
For shareholders, the takeaway from this quarter should be that we have not witnessed any sort of impact to the business yet from artificial intelligence. However, what shareholders also need to understand is that the market will not forget about the potential disruption from AI just because of a single good quarter. It will need to put up steady results for quite some time to alleviate fears. If you’re banking on a quick rebound for this one, you likely won’t be happy.
However, if you’re excited to accumulate one of the best compounders in North America at a 30%~ discount for the next while here, knowing that returns are primarily made over the long-term, you’re going to be very happy.
Intact Financial (TSE:IFC)

Intact Financial Corp is a property and casualty insurance company that provides written premiums not only in Canada but globally. The company distributes insurance under the Intact Insurance brand through a network of brokers and a wholly-owned subsidiary, BrokerLink, and directly to consumers through Belairdirect. Most of the company’s direct premiums are written in the personal automotive space. Intact directly manages its investments through subsidiary Intact Investment Management. The vast majority of these invested assets are fixed-income securities. Its asset mix is designed to generate interest and dividend income.
Last year, the boldest call on the Foundational Stock List was the removal of Royal Bank of Canada in favor of Intact Financial. It is a decision I stand by for the long term, even though 2025 didn’t play out exactly as I expected. Royal Bank had a historic 2025, fueled by the integration of HSBC Canada and a massive rally in capital markets and wealth management. In contrast, while Intact posted nearly double-digit growth in operating income, it faced pressure in the middle of the year as the market worried about rising claims severity and a bit of a “sell the news” situation on strong results.
The reason Intact remains on the list for 2026 is that it isn’t just a “good” insurer. It is arguably the most disciplined Property & Casualty (P&C) operator in North America. The industry gold standard for profitability is the combined ratio, and Intact’s performance here is best-in-class. In a year where the broader U.S. P&C industry struggled to hit a 94% ratio, Intact consistently delivered sub-90% results, including an unbelievable 86.1% in mid-2025. Essentially, for every dollar of premiums Intact collects, they are keeping nearly 14 cents as pure underwriting profit before they even factor in investment income.
Intact’s secret weapon is underwriting, but from a data perspective. Because they are the largest player in Canada with roughly 20% market share, they have a data moat that smaller insurers simply cannot replicate. This allows them to price risk with precision, avoiding the bad business that drags down competitors. This is precisely why they maintain returns on equity that are ~5% greater than the industry.
So why Intact over Royal again in 2026? I own both, of course, but I am banking on the P&C cycle over the banking cycle moving forward. Banks are currently navigating a soft landing with slow housing activity and rising provisions for credit losses. Intact, meanwhile, is operating in a “hard market” where they have successfully pushed through 10%–11% rate increases in personal auto and property. These price hikes are now fully baked into their earnings, which means in 2026 Intact’s share price should catch up to its fundamentals.
Management is targeting 10% annual growth in net operating income per share over the next decade. If it can achieve this, I would have a hard time imagining it does not outperform the index.
With a $3.3 billion capital margin and a debt-to-capital ratio that they’ve successfully got down to 17.9%, they have the dry powder to make another major acquisition. This industry is heavily fragmented. Intact is one of the larger players in North America and owns less than 20% market share. In this instance, I’d rather own the company that is pricing risk better than everyone else than a bank that has already priced-in its best-case scenario. Don’t get me wrong, I love Royal Bank. But, I love Intact more, especially after a “meh” year from the insurer despite strong results.
I expect to see double-digit Net Operating Income per Share (NOIPS) and EPS growth as their recent rate increases in personal auto and property, which are currently tracking in the high-single to low-double digits, continue to flow through the bottom line. Even as they prioritize profitability, Intact is positioned to deliver mid-single-digit premium growth across all segments, effectively outperforming the broader industry yet again.
- Catastrophe losses. As the global climate changes, more and more catastrophic weather events are occurring. Ultimately, underwriters will be able to absorb most of these losses with higher premiums. However, depending on how fast they occur, it can hit insurance companies hard.
- Investment returns. Insurance companies generate income from their investment portfolios. The model is simple. Collect premiums and invest those premiums in low-risk assets to earn additional profits. That said, volatile equity and bond markets can impact insurers.
- Artificial intelligence. Intact has moved into “agentic AI.” In 2026, it is expected that over 75% of their commercial quotes will be processed through proprietary AI tools that eliminate manual entry and refine pricing. The trend to follow is how much this technology widens their ROE outperformance.
- Self-service. Intact’s 2026 target is to have 3 out of 4 customers digitally engaged. This isn’t just about convenience for clients. Sure, that’s part of it. But the other part is about lowering the expenses of the business. By moving more customers to self-service, Intact can keep more of every premium dollar. This will allow it to squeeze out smaller competitors that simply cannot offer the rates Intact does.
There are 3 main KPIs for insurance companies. One of them being, Direct Premiums Written (DPW), which is the total amount of insurance premiums collected over a period of time. The second KPI would be Net Earned Premiums (NEP), which would be the amount of premiums the company earned over that time.
Sound confusing? It’s relatively simple. If someone pays an annual auto policy today for, let’s say, $1200, that entire $1200 would go into DPW. However, it would gradually go into NEP over the next year, as the company still has to provide the consumer coverage for 12 months.
The final KPI would be the combined ratio. This measures the amount of premiums the company collects compared to the amount they have to pay out in claims. I explain more of that in the thesis of Intact above.

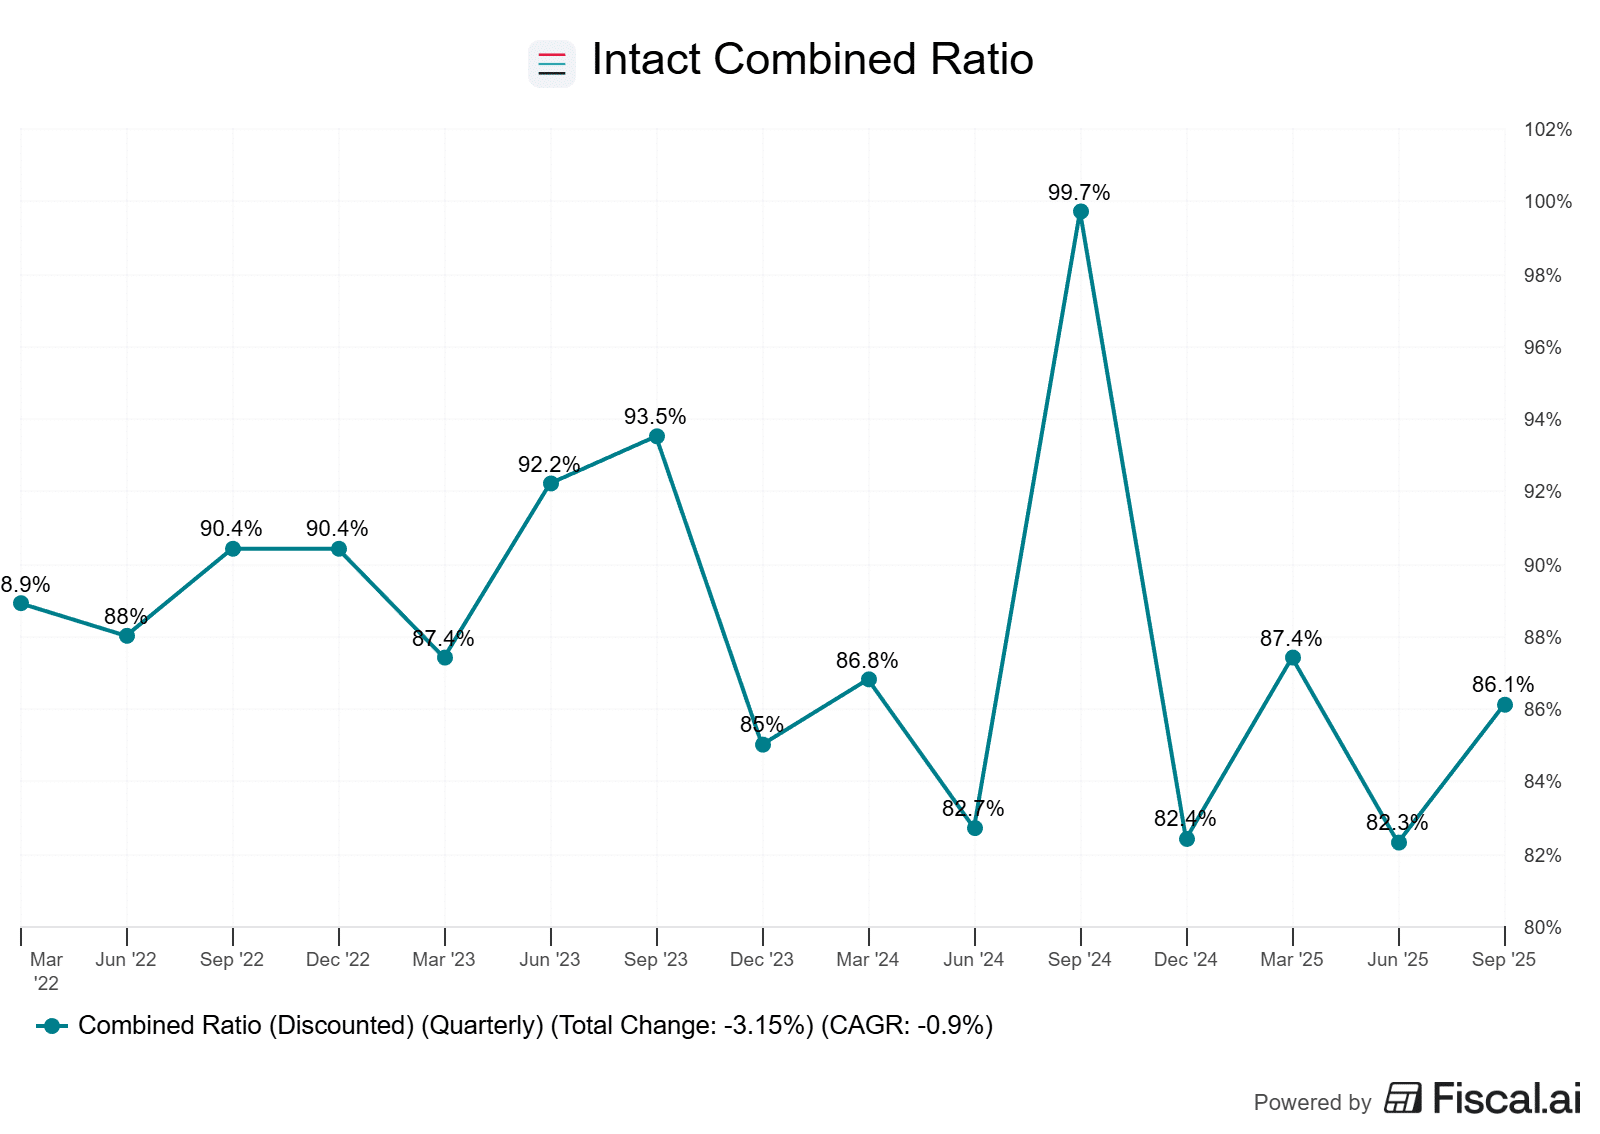
February 11, 2026 – Intact Financial’s fourth-quarter results were exceptional. Net operating income per share (NOIPS) of $5.50 far outpacing the $4.70 analyst consensus and EPS of $5.24 also came in well ahead of the $4.48 consensus.
A quick refresher on NOIPS versus EPS. Think of it like a professional athlete. EPS is their total bank account balance including endorsements, advertising, guest appearances, while NOIPS is just the salary they earned for actually playing the game. NOIPS is the money Intact makes by doing what it does best, and that is selling insurance.
This performance was a record-breaking year where full-year NOIPS came in at $19.21, a 33% increase over 2024. The bulk of this was due to a massive 61% jump in underwriting income to $2.7 billion. The combined ratio came in at 88.2% for the year, which benefited from a relatively mild catastrophe season. It seems like this is the first time in forever we haven’t had a massive year of floods, fires, or other catastrophes. Remember, the combined ratio is premiums collected versus claims paid out. For a long time, catastrophe losses had Intact in the low 90% range. Now we’re seeing the benefits of a mild situation. How long it lasts? It is difficult to say.
However, something else to note is that the company reported it is currently trimming off around $150M~ a year in expenses due to the use of AI. I don’t think this can be overlooked. As the technology gets better and better, the savings are likely ramp up. If underwriting can be improved via AI, this ultimately leads to more money in Intact’s pocket.
While the Canadian segment remained the primary growth driver with a 76.4% personal property combined ratio, the U.S. business showed the most dramatic improvement, dropping its combined ratio by 3.3 points to 82.8% on the back of solid underwriting. Conversely, the UK and Ireland remained a transition story, with premiums dipping 2% as the company prioritized quality versus quantity. This has been a drag on the business for a while in my opinion. However, it is a smaller portion of the business, so it has some time to turn around. What you really want to see is the strong operations in Canada and the US, and we’re seeing that.
The company saw a 16% year-over-year increase in book value per share to $107.35 and an operating ROE of 19.5%. The company raised the dividend by 11% and repurchased $198 million in shares over the course of the year. Beyond the immediate numbers, the long-term outlook remains bullish. The company is targeting 10% annual NOIPS growth and a return on equity that outpaces the industry by 500 basis points. It’s already doing this on both fronts. So, I guess the outlook is status quo, and the status quo is currently outstanding.
This growth is expected to be fueled by high-single-digit premium increases in personal lines and the continued expansion of high-margin specialty verticals. With a total capital margin of $3.7 billion and a debt-to-capital ratio that has fallen to 16.5%, the company is now positioned with significant dry powder for future acquisitions. It has paid off all of its debt from its acquisition of Direct Line’s commercial operations in the UK.
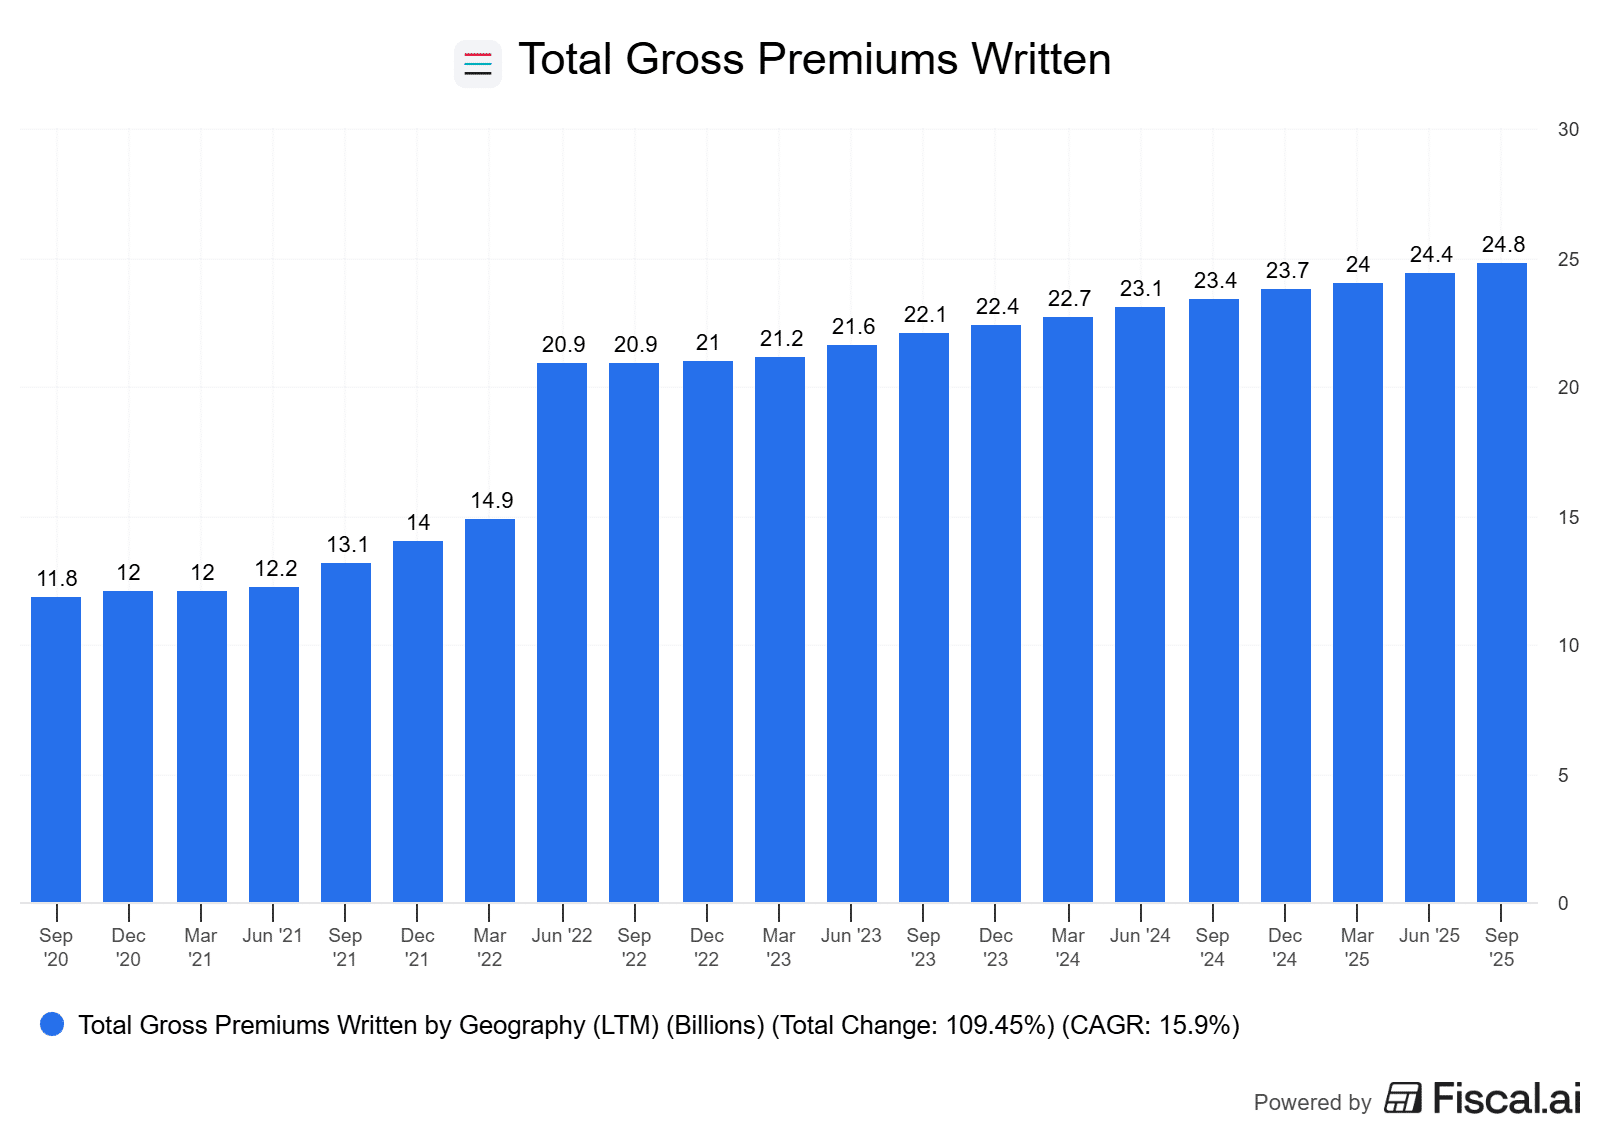
Waste Connections Inc (WCN.TO)

Waste Connections provides non-hazardous waste collection, transfer, disposal, and resource recovery services in the United States and Canada. It offers collection services to residential, commercial, municipal, industrial, and exploration and production (E&P) customers; landfill disposal services; and recycling services for various recyclable materials, including compost, cardboard, mixed paper, plastic containers, glass bottles, and ferrous and aluminum metals. The company also owns and operates transfer stations that receive compact and/or load waste to be transported to landfills or treatment facilities through truck, rail, or barge; and intermodal services for the rail-haul movement of cargo and solid waste containers in the Pacific Northwest through a network of intermodal facilities. In addition, it provides E&P waste treatment, recovery, and disposal services for waste resulting from oil and natural gas exploration and production activity, such as drilling fluids, drill cuttings, completion fluids, and flowback water; production wastes and produced water during a well’s operating life; contaminated soils that require treatment during site reclamation; and substances which require clean-up after a spill, reserve pit clean-up, or pipeline rupture.
As we move into 2026, Waste Connections (WCN) is shifting from a purely defensive inflation hedge into the primary beneficiary of a recovering industrial cycle. In 2025, the stock took a backseat as the market chased risk-on growth. However, this relatively quiet period has allowed the company to build a foundation that is now a coiled spring for the next half-decade, in my opinion.
The long-term thesis? Waste Connections operates with a substantial economic moat that is remarkably difficult for competitors to cross. The pillar of the moat is the company’s focus on secondary and rural markets, where they often maintain a market share of over 50%.
Its competitor Waste Management, on the other hand, does the complete opposite. It tends to focus on highly competitive urban areas. By avoiding the cutthroat competition of major urban centers, Waste Connections secures a position as the dominant, or sometimes the only provider, in these areas. Make no mistake, the selection of Waste Connections over Waste Management is strategic. I like the small-ball acquisition strategy more than the larger splashes.
The core of this year’s thesis is the intersection of high pricing power and an expected recovery in cyclical volumes (see the KPI section for a visual representation of this).
Over the last few years, Waste Connections was aggressive with pricing increases, reaching core price growth of roughly 6.7% in late 2025. Not only did this combat inflationary pressures, but it was over and above inflation, allowing it to offset weaker volumes with higher prices.
As we head into 2026, I think we will see a rebound in construction and large-scale infrastructure projects, driving a surge in high-margin waste and landfill volumes. This volume recovery allows the company to apply its new, higher pricing models to a growing base of activity, creating significant operating leverage.
On a valuation basis, Waste Connections can look expensive. It currently trades at a P/E ratio of over 70x, which is higher than many major tech companies growing at double the pace. However, this premium valuation is often misunderstood. Much of WCN’s true value is tied up in its landfills, assets that are nearly impossible to replicate today due to regulatory hurdles, yet these are held on the balance sheet at historical cost minus depreciation. Because these assets were often acquired years or even decades ago, their book value does not reflect the massive replacement cost or their true market value in 2026. This creates a hidden asset base that justifies a higher multiple than a glance at a standard screener might suggest. The market knows the true value of these assets. The company’s book value does not reflect the true value. This is where you see high valuations.
Back to expectations, management has already signalled a strong outlook for 2026. They expect mid-single-digit revenue growth driven by this price-led organic strength. Also, the company is finally beginning to see the benefits of its massive self-help initiatives.
During 2025, the company hit multi-year lows for employee turnover, which has set the stage for continued outsized margin expansion. These internal efficiencies mean that as industrial volumes return in 2026, the company can process them far more profitably than it could two years ago.
Waste Connections remains a Foundational Stock because it offers a rare combination of defensive stability and cyclical upside. We have to remember, this is a defensive business that is up 1100% over the last decade.
While the market spent 2025 chasing high-multiple tech stories, Waste Connections was quietly improving its operations. Reducing turnover, integrating high-margin renewable natural gas projects, and maintaining the pricing power that only a company with a moat as large as Waste Connections can.
The choice to hold WCN over its larger peers is a bet on a superior strategy of dominating secondary markets and the disciplined approach to “small-ball” acquisitions. By 2026, the narrative will likely shift from how much the stock costs to how much cash it generates as construction volumes return to a now-optimized and higher-priced network.
- Volume growth. For 2026, the key trend is the re-acceleration of volumes. We’re starting to see this in some of its specialty segments. For a long time, pricing growth has been the focal point. Now, let’s see how well the company performs when volumes return.
- Investments in personnel. This often goes overlooked, but it is a substantial headwind for many waste companies. In the waste business, turnover is a massive hidden cost due to training and accidents. So, Waste Connections has spent a ton of money in this regard, and voluntary employee turnover is down over 50% from its 2022 peak. The key will be seeing how much it helps improve margins in 2026.
- RNG. Waste Connections is currently in the middle of a $200 million capital investment cycle to bring a dozen RNG plants online. In 2026, a lot of these plants will move from construction to operation. This represents a new revenue stream that is entirely separate from its normal business operations.
- Acquisition execution. Waste Connections’ bread and butter is the $5 billion pipeline of smaller, private operators in secondary markets. Because WCN is a decentralized operator, they excel at buying small firms and immediately plugging them into its high-margin landfills. Last year, they added $300M in annualized revenue from these deals. Look for the pace to increase in 2026.
Core pricing growth is the main KPI behind Waste Connection’s results. However, another KPI is volume and recycling growth. The comparison of the two is what makes Waste Connections look so strong. If you look to core pricing, it increased by 9.5% on the year despite volumes declining pretty much across the board. This highlights the strength of Waste Connection’s economic moat and pricing power.
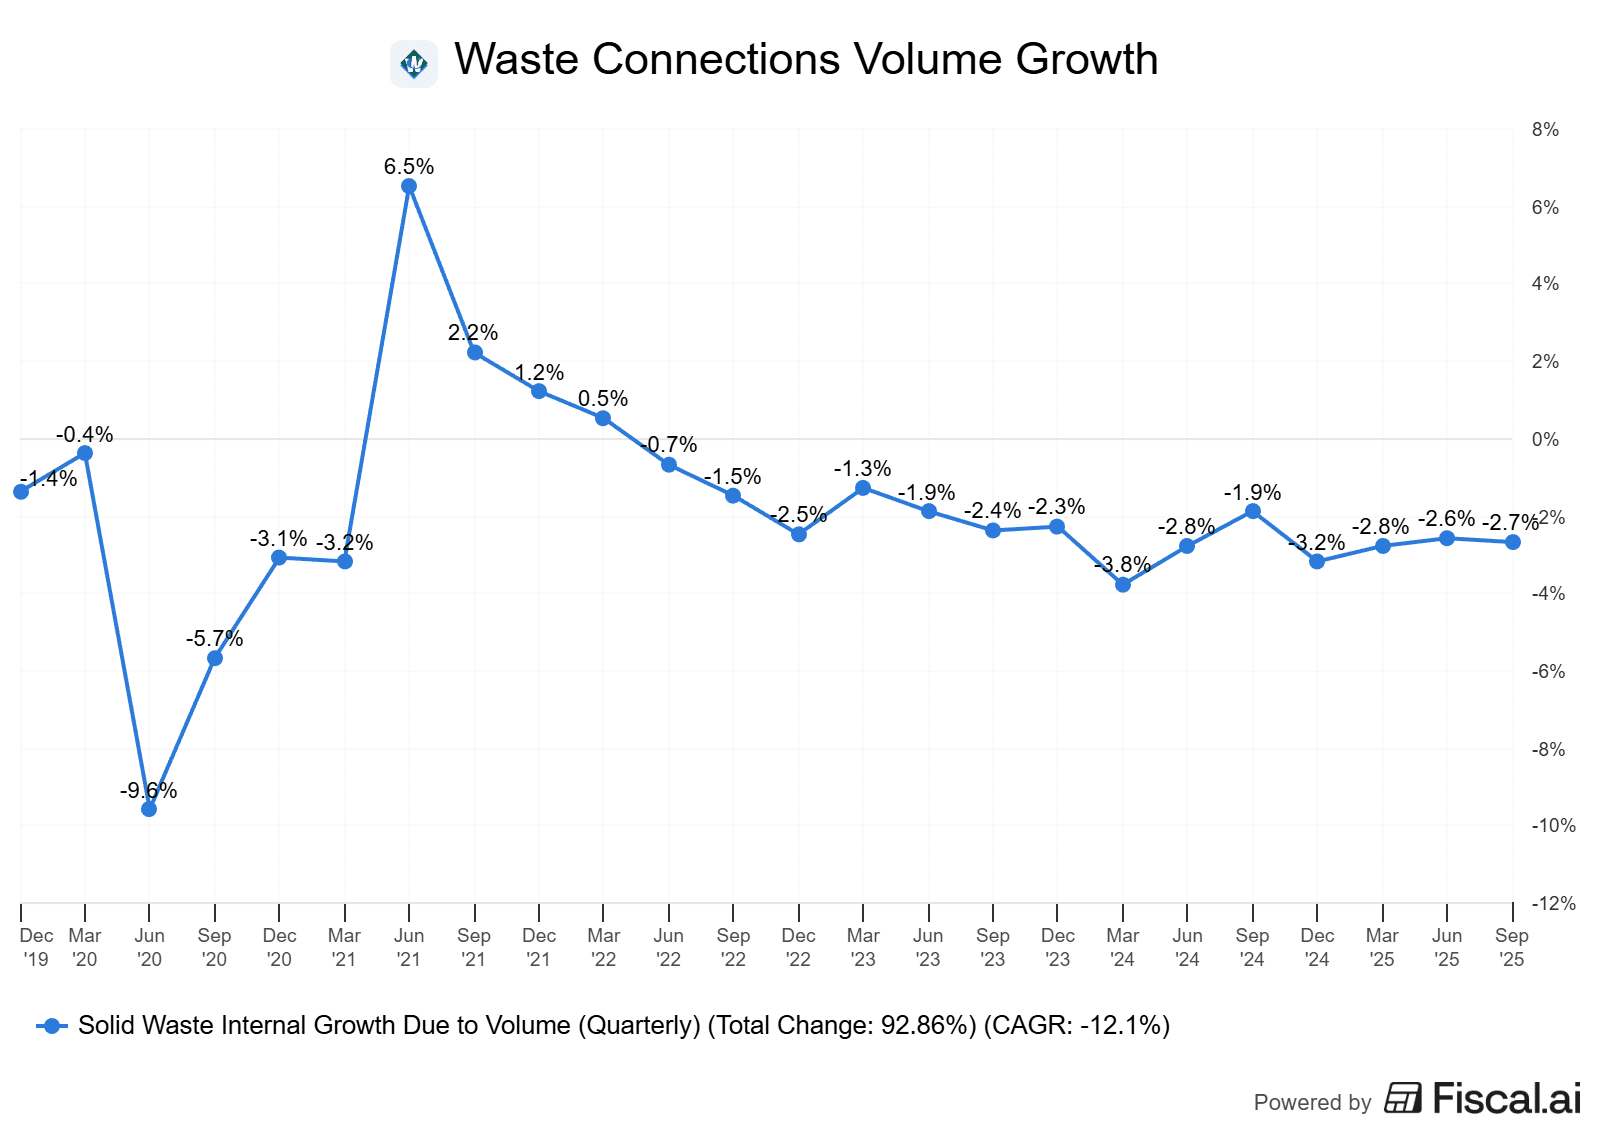
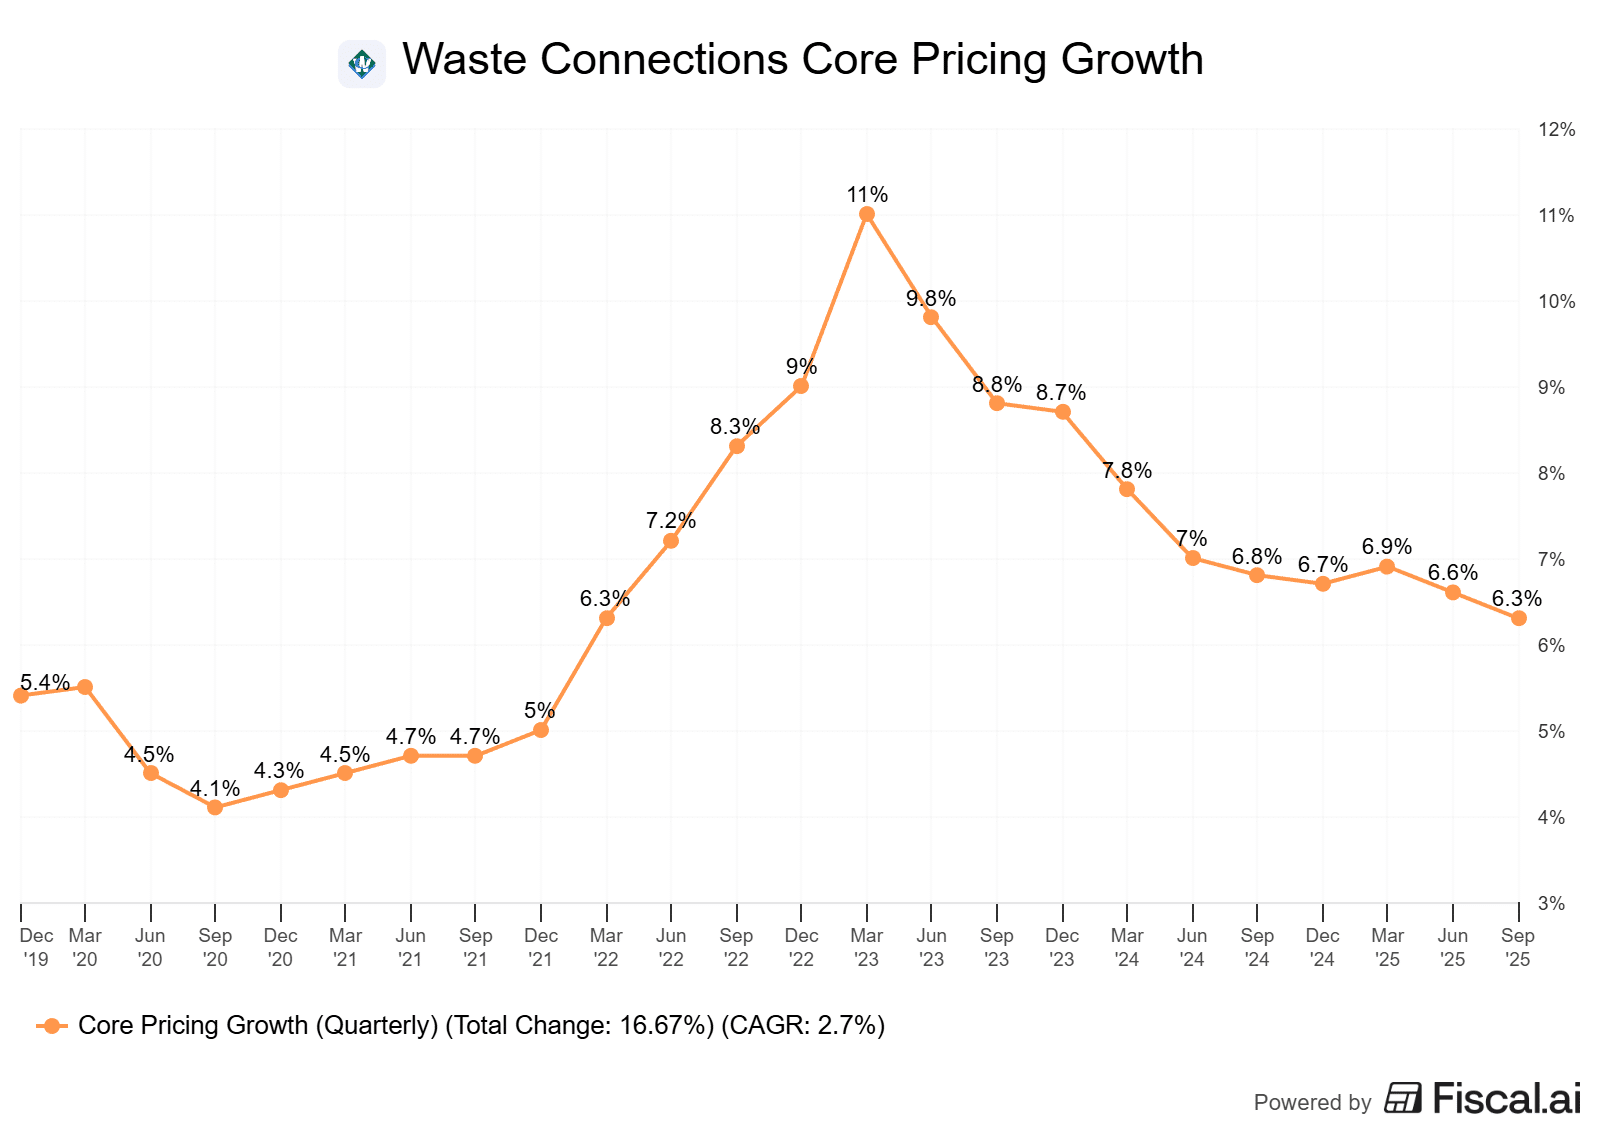
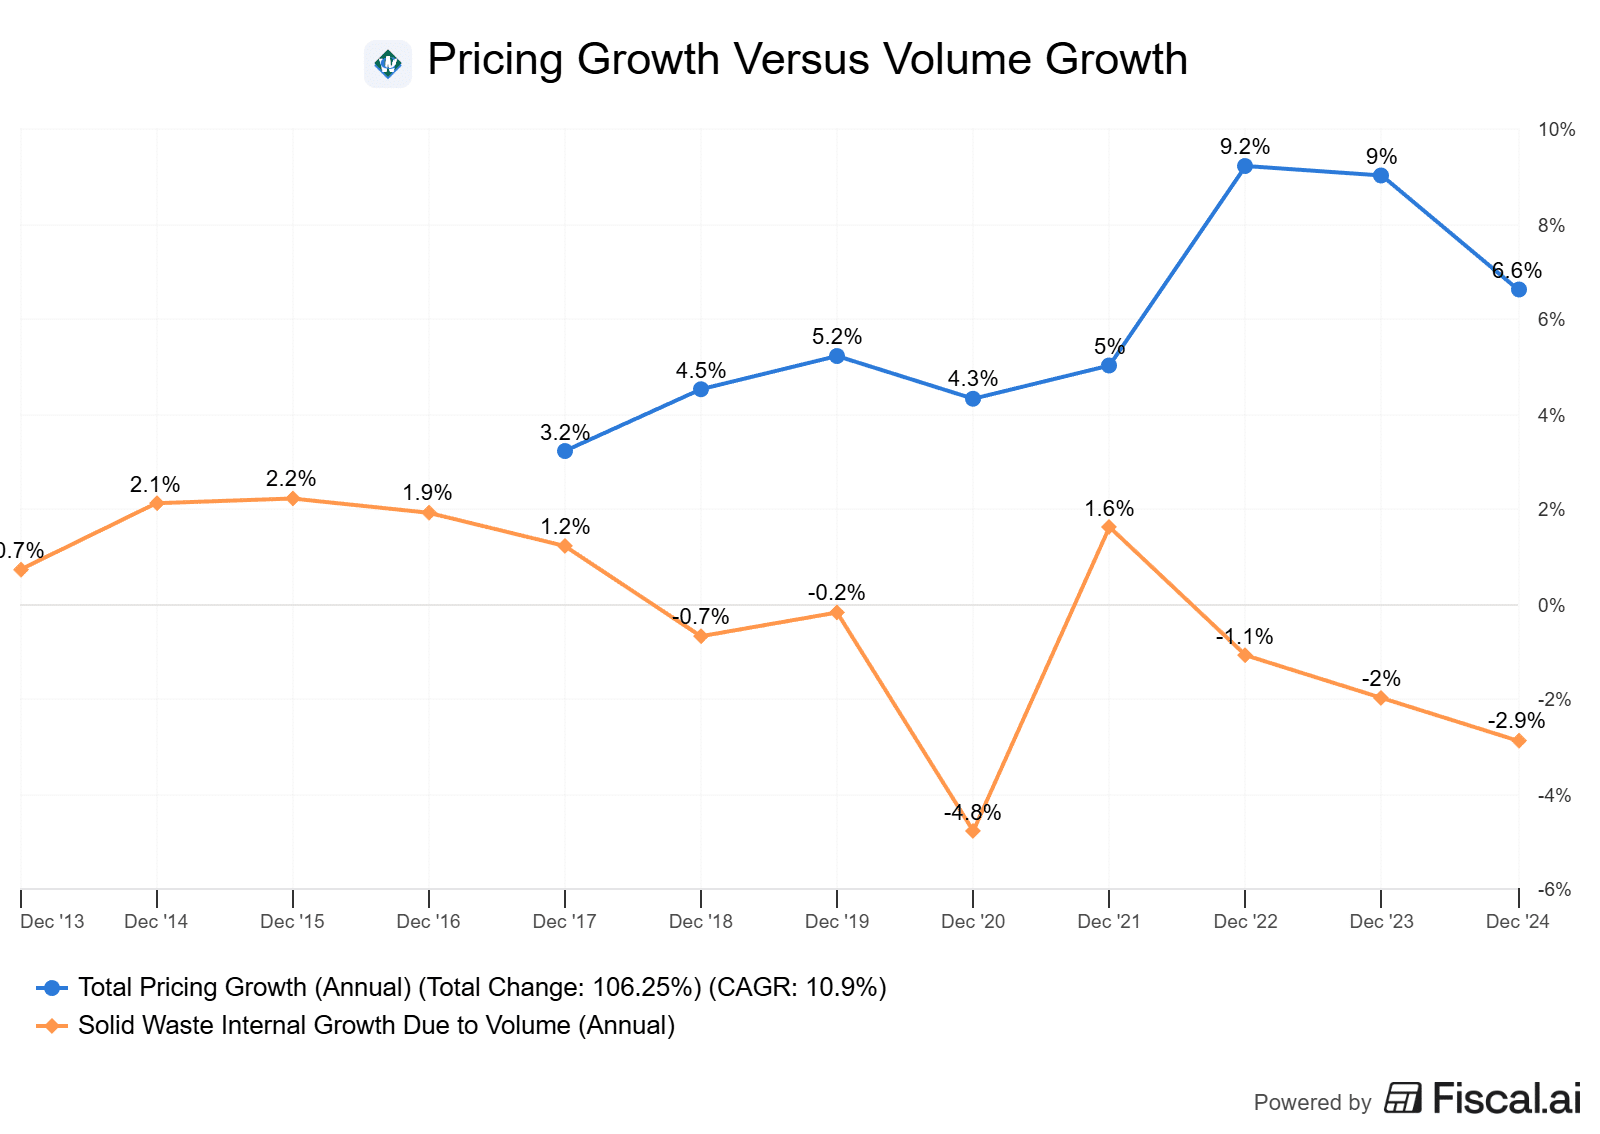
Feb 13, 2025 – Waste Connections reported a solid quarter. Revenue came in at $2.45 billion, a 5.1% increase year-over-year, driven by strong solid waste pricing and acquisitions. This has been the case for quite some time. Volumes are going down due to a sluggish macro environment, but pricing increases are offsetting the impacts.
Volumes declined another 2.7%. However, management stated it was intentional. They’re shedding of low-margin contracts. But, in addition to this, they did mention the sluggishness in construction-related activity. Despite all this, the company posted adjusted EBITDA margins of 33.8%.
On the margin front, there was a 80-basis-point expansion in solid waste margins, which ultimately offset 70 basis points of headwinds from declining recycled commodity prices. Another very underrated aspect of margin expansion was the company’s personnel improvements. The company reported record-low safety incident rates and a voluntary employee turnover rate has plummeted 55% from its peak in late 2022. These improvements translate into pure profit growth, directly impacting margins.
The company’s growth strategy remains in tact, with approximately $300 million in annualized revenues from acquisitions closed or under definitive agreement year-to-date, including two major private wins in Florida and a transfer station in New York City. Looking ahead to 2026, the company provided framework projecting mid-single-digit revenue growth and continued margin expansion. W
The company is investing heavily into Renewable Natural Gas (RNG) projects. The difficulty here is the money will be spent today and won’t be impacting the bottom line until the end of 2027, at least. However, there is large financial benefit here, just need patience.
Additionally, the company is roughly one-third of the way through its digital transformation, using AI for pricing analytics and route optimization. Early results from these investments have already shown a 30% to 40% reduction in customer churn in pilot locations. AI is hitting every area of the market. For most, in a bad way. But in Waste Connections case, it’s a good thing.
The company also raised its dividend by 11.1%, marking its 15th consecutive annual double-digit increase, and continues to be opportunistic with share repurchases. With valuations getting more attractive here, I would not be surprised if they ramped repurchases up.
Despite economic uncertainty and commodity volatility, Waste Connections is performing well. With leverage ratios in the 2.75x range, the balance sheet is strong enough to sustain further acquisitions which should allow it to continue to compound. Ignore the noise on this one in the short-term. It is an outstanding business, now trading at an even fairer price.
Canadian Natural Resources Ltd (CNQ.TO)

Canadian Natural Resources Ltd is an independent crude oil and natural gas exploration, development, and production company. The Company’s exploration and production operations are focused in North America, largely in Western Canada; the United Kingdom (UK) portion of the North Sea, and Cote d’Ivoire and South Africa in Offshore Africa. The Company’s exploration and production activities are conducted in three geographic segments: North America, the North Sea, and Offshore Africa. These activities include exploring, developing, producing, and marketing crude oil, natural gas liquids, and natural gas. The company has two divisions; Oil Sands Mining and Upgrading, Midstream and Refining. It derives a majority of its revenue from North America.
While the energy sector has been rocked by recent geopolitical shifts, CNQ continues to prove why it is the gold standard of North American oil and gas. Not because it avoids volatility, but because management has proven over and over again it can navigate through it.
The primary thesis for CNQ remains its asset base. While most Canadian peers manage a proved reserve life of around 16 years, CNQ boasts a 32-year proved reserve life index. This is the ultimate moat. The company owns more than 5 billion MMBOE in reserves, the largest in Canada, allowing it to maintain steady production without the constant, expensive “treadmill” of aggressive new drilling.
With oil sands mining and upgrading costs averaging roughly C$21 per barrel, CNQ can generate healthy adjusted cash flow as long as WTI remains above USD$40 per barrel. Even with the 2024–2025 lull in pricing, CNRL has been able to outpace Suncor and Imperial on a total-return basis over the long arc because its maintenance capital requirements are significantly lower, leaving more excess cash for shareholders. Sure, the other two have performed better over the short-term, but that’s also because they were coming off of a lower base due to being in the penalty box for many years.
As we move into 2026, the biggest headline risk, and the most unique part of this year’s thesis, is the U.S. military operation and leadership change in Venezuela. The capture of Nicolas Maduro and the prospect of U.S. oil firms rebuilding Venezuela’s industry has caused temporary jitters in the Canadian heavy crude market.
Many fear that a ramp-up in Venezuelan heavy oil will flood the U.S. Gulf Coast, displacing Western Canadian Select (WCS). However, the reality is that the Venezuelan oil industry is fundamentally broken. Experts estimate it will take billions of dollars and many years of infrastructure restoration before Venezuela can meaningfully challenge Canada’s scale and reliability.
Here is another interesting aspect. Unlike its peers, CNQ has the flexibility to shift more barrels toward the Trans Mountain expansion (TMX) for Asian export if U.S. Gulf Coast demand softens. This optionality protects CNQ to a certain degree.
While the company previously targeted a 100% free cash flow (FCF) return once net debt hit $10B, the $6.5B acquisition of Chevron’s Athabasca and Duvernay assets in 2024 has temporarily moved that target to a 60% FCF distribution.
By acquiring these assets at discounted valuations during a low period, CNQ is effectively buying future cash flow. Even though the percentage of FCF being returned is lower (60% vs. 100%), the absolute dollar amount remains competitive because the asset base is now larger and more productive.
In a nutshell, eventually CNQ should be able to return to that 100% FCF return policy, and when it does, it will be doing so off a larger and more profitable asset base.
CNQ entered 2026 with a 25-year dividend growth streak, a Canadian record that Suncor, Imperial, and Cenovus simply cannot touch. With a healthy yield in the 5.3%–5.5% range and a payout ratio well-covered by operational cash flow, the dividend remains the safest in the sector.
Owning CNQ in 2026 is a bet on the survivor of the fittest. By combining the lowest cost-per-barrel in Canada with the longest reserve life in the world, CNQ is the only producer that provides true torque to higher oil prices while offering a fortress balance sheet when prices dip. The Venezuela situation is a distraction for traders. For investors, it is a reminder that Canada, and CNQ specifically, remains the most reliable, rule-of-law-backed provider of heavy crude on the planet.
- Venezuela impact. Given that Venezuela’s infrastructure is currently decimated and limited to roughly 1 million barrels per day, it would take years and billions in investment to reach its former 3.5 million bpd peak. For CNQ, the real trend is the “Rule of Law” premium. As long as Venezuela remains politically erratic, U.S. refiners will continue to prioritize the reliability of Canadian heavy crude.
- The shift to greener energy. As climate change continues to gain steam, more and more governments and regulatory bodies are pushing towards alternative forms of energy.
- Production growth. Canadian Natural already has a large production base, which helps generate consistent cash flow in pretty much any environment. However, it will need to continue to expand its production base to continue to grow, as new project investments are slowing considerably.
- The path back to 100% free cash flow return. Watch for how quickly the company approaches that $12 billion floor. Once hit, the automatic trigger to return 100% of FCF to investors will likely lead to a massive surge in share buybacks, which, combined with their 25-year dividend growth streak, makes CNQ the most potent total-return play in the Canadian energy space.
There is a multitude of key performance indicators you could look at with oil and gas companies, including average cost per barrel, realized prices, and more. Unfortunately, Finchat only tracks one, which would be the production numbers. This isn’t all that bad, as this is arguably one of the more important KPIs. As you can see, the company’s production numbers continue to excel as it remains one of the most efficient producers in North America.
November 8, 2025 – Canadian Natural delivered a very strong Q3, especially considering the softer energy environment. The company hit record production of about 1.62 million barrels of oil equivalent per day, up 19% year-over-year, with solid performance across oil sands, heavy oil, light oil, and natural gas.
Costs stayed low across the board, which is why I love this oil producers. Oil sands mining operations produced over 580,000 barrels per day at just over CAD $21 per barrel, and thermal in-situ production came in around CAD $10.35 per barrel. Even in conventional oil, heavy crude output rose while costs fell, and natural gas production jumped 30% year-over-year with very efficient operating costs around CAD $1.14 per mcf.
The company brought in nearly CAD $3.9 billion in cash flow. It returned $1.5 billion to shareholders this quarter alone through dividends and buybacks, bringing year-to-date returns to over $6 billion. The company raised the dividend, and the balance sheet remains ultra-conservative, with very low leverage. This is exactly why this company can seemingly operate in any oil environment.
Strategically, Canadian Natural continues to focus on cost discipline and growth from existing assets. In the quarter, the company closed an asset swap with Shell Canada that gave it full ownership of the Albian Oil Sands mine and an 80% non-operated interest in the Scotford upgrader and Quest carbon capture assets.
The deal added approximately 31,000 barrels per day of high-margin, zero-decline bitumen production to its portfolio. Thanks to this transaction, Canadian Natural was able to raise its 2025 production guidance without needing to increase its planned capital spending.
What stands out is the combination of scale, low-cost operations, and a diversified asset base that spans oil sands, conventional oil, and natural gas. It’s also returning a lot of cash to shareholders while keeping debt low.
The company is executing well and positioning for steady growth, but it’s important to keep an eye on factors like transportation constraints for Western Canadian crude, evolving carbon policies, and upcoming maintenance spending. Still, if there was one energy company I would choose to buy and hold indefinitely, it would be Canadian Natural.
Loblaw Companies Ltd (L.TO)

Loblaw is Canada’s food and pharmacy leader, operating in the retail space through its extensive network of grocery and associate-owned drug stores. The company’s core strength lies in its Retail segment, which sells everything from everyday grocery and health and beauty products to apparel and general merchandise, all anchored by the massive PC Optimum loyalty ecosystem. While Loblaw has historically operated a Financial Services arm, the company recently underwent a strategic shift by selling its retail banking operations to EQ Bank. This move allows Loblaw to offload the complexities of direct banking while maintaining the integration of its financial products within the PC Optimum framework.
Since the inception of the Foundational Stocks, Loblaw has outperformed the TSX Index 80% of the years it’s been included. Every single year I think to myself:
“Can Loblaw really do it again?”
I spend a few hours mulling over it, running the numbers, and I always come back with the opinion that yes, they can continue to outperform despite a meteoric run. So, here we are again in 2026 with Loblaw on the Foundational Stocks List.
Canada remains in a relentless cost-of-living crisis, and as we head into 2026, the grocery aisle is still the main enemy and arguably the easiest thing Canadian’s can do to trim the budget. Food prices are forecasted to rise another 4% to 6% this year, meaning the average family will be shelling out nearly $1,000 more for the exact same basket.
For a value-focused retailer like Loblaw, this environment is a gigantic advantage. You’ve heard me mention that for the better part of 4 years now, but I’ll continue to do so. As consumers continue to trade down to manage their budgets, Loblaw’s massive discount footprint through No Frills and Maxi acts as a literal magnet for traffic. Prior to COVID, I was a shopper at Sobeys. Now, 99% of my grocery purchases are at No Frills or Costco.
While the necessity of groceries provides a bit of a floor, management’s capital allocation is what has provided the ceiling for outperformance. We are seeing a masterclass in how to deploy cash.
The recent sale of their retail banking operations to EQ Bank for roughly $800 million is a perfect example. By offloading the capital-intensive banking side while retaining a 16% stake in EQB and keeping the PC Optimum integration, Loblaw has simplified its business. All while still keeping the exposure to the growing financial arm, just through another publicly traded entity.
This shift is already showing up in the numbers through operating margin expansion.

Management isn’t just sitting on cash; they are funnelling billions into high-return projects like automated distribution centers and the expansion of their ultra-discount No Name stores. These investments are specifically designed to strip out labor costs and improve supply chains, allowing them to keep prices competitive while growing their margins.
Furthermore, the timing of their share buybacks remains exceptional.

Management has consistently used their large amounts of free cash flow to retire shares when the market underestimates their growth profile, which has been a massive driver of the low-to-mid teens earnings growth we’ve seen despite revenue only increasing 3-4%.
Even with the political noise that occasionally surrounds the company, the economic reality is undeniable. Loblaw is outpacing peers like Metro and Empire because it is reinvesting in the right places and has a larger discount presence. Because Loblaw generates so much free cash flow and reinvests so much back into the business, it is hard for the other players to catch up.
I think all of these factors are multi-year tailwinds for the company, which is why it remains on the list for 2026.
- Discount supremacy. While many expected “deal-chasing” to normalize, it has instead become a permanent consumer behavior. This isn’t all that surprising, as the cost of food is expected to go up by yet another $1000 per family in 2026. Loblaw is funnelling a ton of money into No Frills and Maxi, their discount brands, banking on continued momentum in this regard.
- Efficiency. Loblaw is currently in the middle of a massive $10 billion investment cycle, with a heavy emphasis on distribution centers. The goal here is simple, and that is to use automation to offset rising labor and logistics costs. Keep a close eye on operating margins. If they continue to expand in 2026, it’s fairly clear that what the company is doing is working.
- Cash from PC Financial Sale. By selling its retail banking operations to EQ Bank, Loblaw has unlocked significant capital while still somewhat maintaining exposure to the financial end via a stake in EQ Bank. How they deploy this cash could compound the impacts of the sale. At these valuations, I’d prefer business expansion/improvement over buybacks. But I expect both, and I am happy with either.
- E-commerce dominance. Loblaw is currently growing digital sales at a double-digit clip, nearly hitting 20% growth in some quarters. This was a fad I thought would be gone post-pandemic. But all it’s doing is accelerating. The company is now integrating personalized flyers for specific shoppers via the PC program, which is genius. It encourages a higher spend by offering attractive prices on items people have been known to buy often in the past.
Loblaw segments its business into two areas: Food and Pharmacy. It then tracks the same-store sales growth for those segments. This would be growth that does not factor in new stores. Why is this an important KPI? Because new store builds are relatively capital-intensive. The more a retailer can grow organically, the cheaper that growth is versus new store expansion. As you can see, it is slowing from the pandemic era. However, it is still strong for a large-scale retailer.
The second KPI would be total store counts for Loblaws, which would be the reverse. This shows how fast the company is growing via expansion into new areas. Both are useful in judging the overall trajectory of a retailer. You can see a decline in Loblaw store counts. This is because it is closing down some of its higher-scale stores and shifting to more discount options.
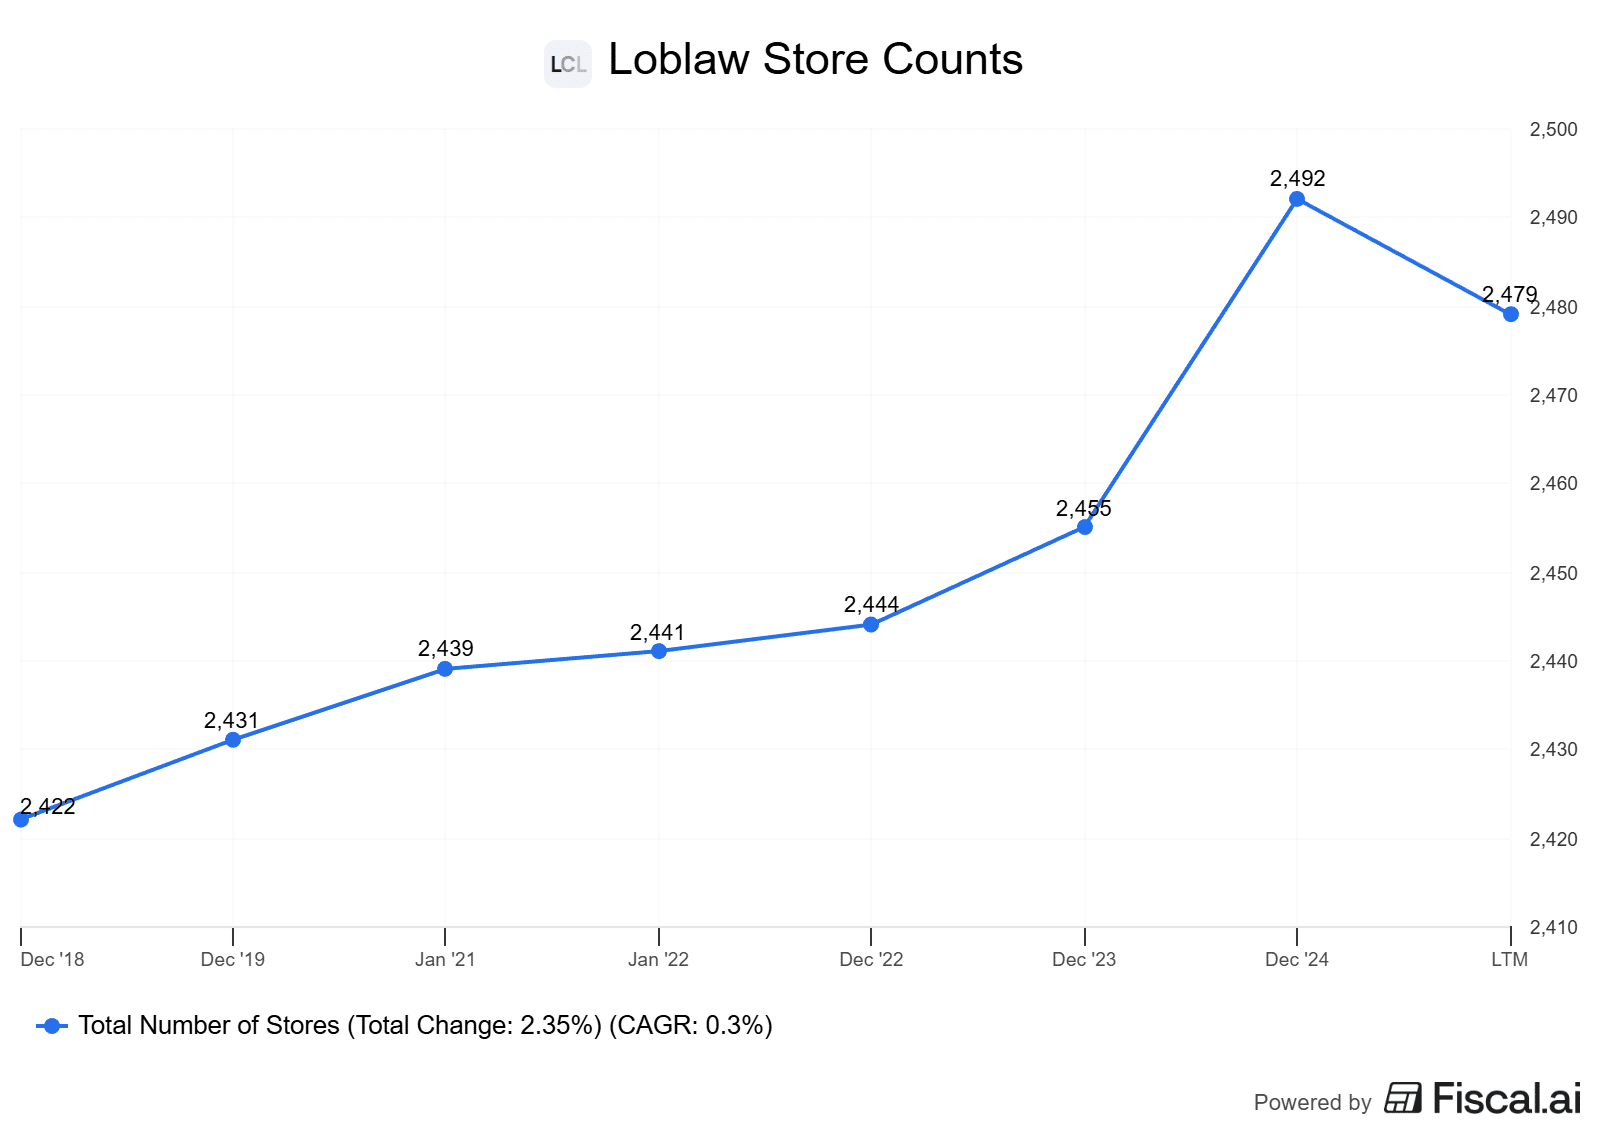
November 12, 2025 – Just when you think Loblaw might finally hit a plateau, it delivers another masterclass quarter. Sure, it’s not growing by 30-40% or anything, but we do need to understand that this is a low margin, high volume grocer that is consistently putting up double digit earnings growth quarter after quarter. That, in my opinion, is masterclass for the sector.
The recent results prove that the company’s pivot toward hard discount and high-margin services is paying off. However, I’ve been mentioning this as the core thesis for Loblaw for years. It’s one of the main reasons you see it on the Foundational Stock list. On a comparable 12-week basis, revenue grew a steady 3.5%, but the real story is in earnings, as it always is, where adjusted earnings per share jumped 10.9%. When I say comparable 12-week basis, this is simply because Loblaw had fewer days last year during this quarter. So, if we compare pure numbers, earnings increased by over 20%. But, this isn’t a fair comparison.
The earnings growth continues the now well-known Loblaw trend. Squeezing double-digit earnings growth out of single-digit sales gains. They are doing this by attacking their margin profile, made clear by yet another 10-basis point improvement in gross profit this quarter. The company also remains a share-buyback machine, repurchasing nearly 10 million shares this quarter alone.
As mentioned, the backbone of the thesis remains the aggressive expansion of the discount footprint. The company opened 15 new No Frills and Maxi locations this quarter, and is clearly positioning itself exactly where the Canadian consumers are headed right now, that being penny pinching.
While food same-store sales growth of 1.5% is so-so, this is an intentional strategy of capturing market share through new stores and larger traffic. Meanwhile, Shoppers Drug Mart continues to be the the outsized grower of the company. Drug retail same-store sales were up 3.9%, with 5.6% of this coming from a surge in pharmacy and healthcare services. Shoppers is a unique store, and I will admit I didn’t even think growth would be this strong myself. However, the company finds ways to get people into the store to get their prescriptions, and then sells them on the wide variety of items available in the store. Sure, it’s pricey there, but they know consumers will only be picking up an item or two, which leads to a mentality of “well, I’m already here.” Which, is ultimately good for sales.
E-commerce continues to be on a tear, up nearly 20% this quarter. But one thing I’m very interested in is the hidden businesses like retail media and logistics-as-a-service. Management mentioned these are going to be big drivers of growth in 2026. The decision to sell PC Financial to EQ Bank is a solid move to offload the complexities of a bank while retaining the high-value data of the PC Optimum program. Not to mention, they now own a big chunk of EQB as a result.
It was an outstanding quarter from the company, who continues to drive home the idea that it is the best large-cap grocer in North America.
Granite Real Estate Investment Trust (GRT.UN.TO)

Granite Real Estate Investment Trust, or Granite, is a real estate investment trust engaged in the acquisition, development, ownership and management of of logistics, warehouse and industrial properties in North America and Europe. Granite’s portfolio comprises various manufacturing, corporate office, warehouse and logistics, and product engineering facilities. The vast majority of the company’s assets are logistics and distribution warehouses and multipurpose buildings split fairly evenly amongst Canadian, Austrian, and U.S. locations. Granite derives nearly all of its revenue in the form of rental income from its properties.
I will admit, Granite REIT (GRT.UN) was on the cusp of being removed from the Foundational Stock List for 2025. The REIT sector was arguably at its lowest point in decades, beaten up by the fastest rate-hiking cycle in history and a decline in industrial demand with the slower economy. Instead, 2025 proved to be a rock-solid recovery year for the company, and I do think momentum will continue into 2026.
The comeback in 2025 was driven by a mix of rising occupancies and solid asset management. While many expected vacancies to climb as the economy cooled, Granite saw its committed occupancy climb back toward full strength, hitting 97.1% by late 2025. This wasn’t just luck, it was the result of a massive 88% rental rate spread on new leases and renewals. Essentially, when a lease expires, Granite is re-signing tenants at nearly double the previous rent, proving that the demand for tier-one industrial space is still outpacing supply.
Granite outperformed in 2025, in my opinion, because it holds the highest-quality industrial portfolio in the country. As interest rates began to stabilize and even tick downward in late 2025, anxiety that plagued the sector started to fade.
Most REITs struggle to raise the distribution on an annual basis. Not Granite. It is a Canadian Dividend Aristocrat with 14 consecutive years of increases. In late 2025, management put their money where their mouth is again, raising the distribution by another 4.4%. Not game-changing growth. However, we do have to understand that Granite must pay out 90%+ of its earnings back to shareholders. You’re never going to get large-scale dividend growth. Typically, any is a bonus.
Most REITs are yield traps, with payout ratios hovering near 90%–100% of funds from operations. Granite has successfully lowered its AFFO payout ratio to a noteable 67%. This gives them the internal cash flow to fund their own development pipeline, like their 391,000 sq. ft. project in Houston, without having to issue units or debt.
As we head into 2026, the recovery in the broader economy is fueling a second wave of demand for nearshoring and automated distribution centers. Granite’s properties are the physical infrastructure of the digital economy. They aren’t just buildings, they are the essential nodes that make things like one-day shipping possible.
Even after a solid 2025, Granite’s unit price hasn’t fully caught up to the value of its portfolio, in my opinion. As interest rates continue to stabilize, the market is beginning to realize that you are essentially getting a world-class REIT at a discount. Granite has proven it can raise its dividend in a crisis, maintain occupancy in a recession, and grow its cash flow without taking on high levels of debt. It is the definition of a Foundational REIT.
- Industrial real estate demand. With Granite being a pure-play industrial real estate REIT, it goes without saying that the continued demand for industrial real estate is essential for the company to continue growing.
- Rental tailwinds. As more legacy leases expire in 2026, the company is effectively getting a built-in organic growth engine that doesn’t require a single dollar of new debt; it’s simply catching up to the true value of their tier-one industrial space.
- Payout ratios. REITs are structured to distribute 90%+ of their profits back to investors. This is a requirement for them to be filed as a trust. It is important that you keep an eye on the company’s AFFO and FFO payout ratios.
- Property Sales. Management has become much more aggressive in capital recycling, which means selling older, less efficient assets to fund the buyback of their own undervalued units or new developments. Heading into 2026, they have roughly $371 million in assets held for sale, with a goal to close most of these by year-end. Keep an eye on whether or not these sell.
There are 4 main KPIs that I track with Granite REIT. The first, and arguably most important, is Adjusted Funds From Operations, or AFFO. This is the most important bottom-line number when it comes to a REIT, as it factors in things like routine maintenance, capex utilized to improve properties, etc. The second is occupancy rates. The third would be gross leasable area, which is the total amount of square footage (in millions) Granite has to lease. And finally, we have income-producing properties, which is the total amount of properties Granite has to lease out to customers.

November 8, 2025 – Granite REIT delivered a strong third quarter. Funds from operations increased to $1.48 per unit, up 6.5% sequentially and nearly 10% year over year, with most of that gain driven by net operating income (NOI) growth. Same-property NOI climbed 5.2%, reflecting rock solid leasing and the ability for the company to have CPI-index rent escalators.
The company tightened its 2025 guidance range and raised both FFO and AFFO forecasts, now expecting per-unit growth of 7% to 9% and 4% to 5% respectively. It is a fairly strong signal that the environment for industrial REITs might finally be turning a corner.
Leasing performance was no doubt the standout on the quarter. Renewal spreads hit an impressive 88%, with management noting that roughly 81% of 2025 expiries have already been renewed at a weighted-average increase of 47%. It is important to keep in mind that this type of growth will never continue indefinitely, the company did mention they do expect it to normalize closer to a range of 20%~, which is still exceptional.
Strategically, Granite is deep into a rotation out of lower-growth or over-concentrated markets and into what it deems “Tier 1” industrial properties. Six properties, totaling nearly CAD $370 million, are held for sale, with around half of them already in agreement for sale.
The REIT’s balance sheet is best in class, there is little question about that. Debt is well structured with a weighted average interest rate of just 2.7% and no major maturities until late 2026. Liquidity sits around CAD $1 billion, made up of around $100M in cash and $900M~ in untapped credit facilities. Leverage ticked slightly lower during the quarter, with net debt to EBITDA down to 7x and net leverage at 35%.
Granite bumped its quarterly distribution by 4.41%, which is actually higher than usual. The payout ratio remains comfortably in the mid-60s% range on an AFFO basis. The company is one of the very few REITs that can maintain consistent dividend growth, and it does so through prudent raises.
While some pockets like the Greater Toronto Area remain soft, asking rents were down about 5.5% year over year there, Granite’s diversified footprint make this a non-issue.
Granite is executing well in a tough but improving environment. With over 44% NOI growth per unit over the past three years and a measured approach to capital recycling, the trust isn’t chasing hype or overextending itself via high distributions, it’s quietly compounding.
Shareholders haven’t been rewarded yet, and this company has certainly been the true test of patience, but there is no doubt it is executing.