[]
Login Join Premium

Bull List Report – Boyd Group Services – TSE:BYD

Boyd Group Services – BYD.TO

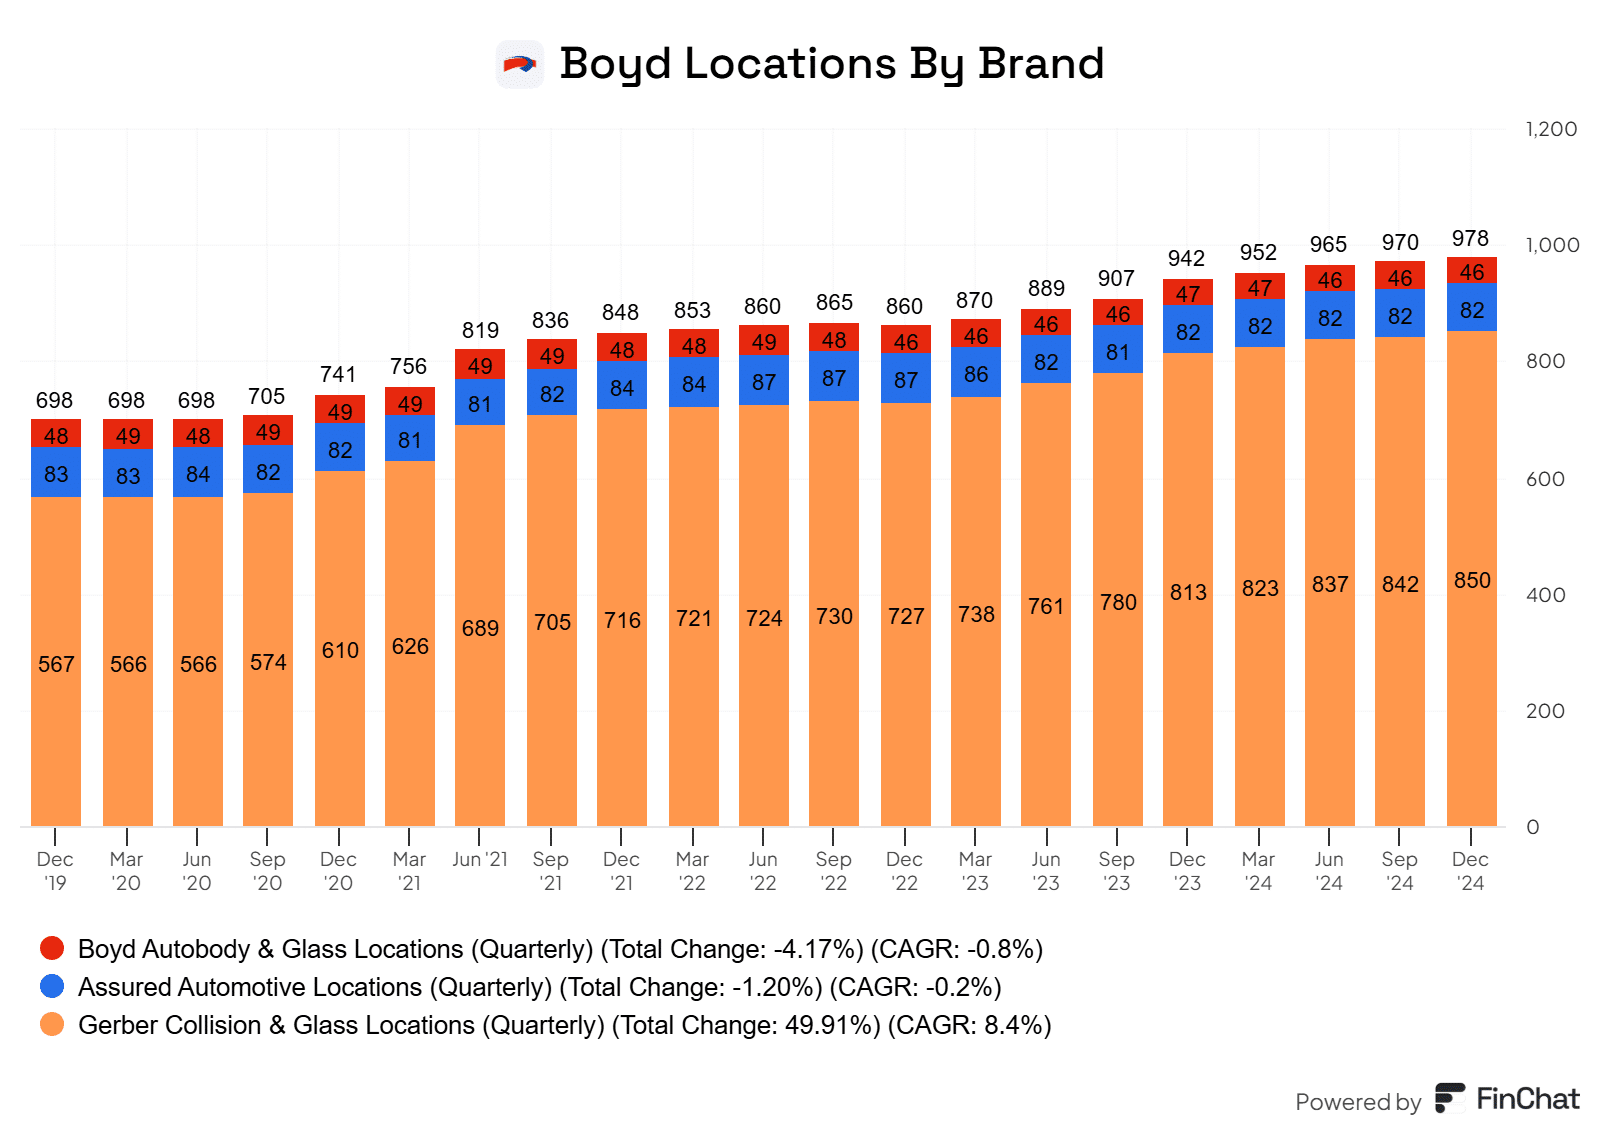
Boyd Group Services Inc is engaged in operating non-franchised collision repair centers in North America. The Company’s primary line of business is automotive collision and glass repair and related services, with the majority of revenues relating to this group of similar services. This line of business operates in Canada and the U.S. and both regions exhibit similar long-term economic characteristics. he Company is also a retail auto glass operator in the United States, under the trade names Gerber Collision & Glass, Glass America, Auto Glass Service, Auto Glass Authority, and Autoglassonly.com. In addition, the Company operates a third-party administrator, Gerber National Claims Services (GNCS), that offers glass, emergency roadside, and first notice of loss services.

Focus area

Score

Valuation

69

Profitability

21

Risk

30

Returns

35

Dividend

48

Outlook

80

Debt

34

Growth

61

Overall

50

Click the KPI images to expand them if needed!

Pros

  • Industry not prone to large economic swings
  • 90% of revenue comes from insurance companies
  • Only publicly traded company in a highly fragmented industry
  • Strong balance sheet
  • If the company can hit its new 5-year targets, it implies 15%~ growth through the next 5 years
  • Valuations are now at decade lows due to short-term headwinds
  • Auto tariffs could bring rising prices to new vehicles, ultimately boosting insurance repairs over write-offs
  • The company is starting to report margin expansion and improving same store sales, signs the turnaround may be starting

Cons

  • Company is known to miss earnings estimates
  • Large amount of its revenue comes from 5 clients
  • Although it got a handle on material and supply costs, tariffs pose another issue to the supply chain
  • As an acquisition-based company, financing costs are taking a bite out of the bottom line because of rising rates
  • Insurance companies are remaining stubborn on writeoffs, which is impacting claims volume

The Boyd Group is one of the largest operators of non-franchised collision repair centers in North America in terms of both location count and sales volumes. The company primarily operates under the name Boyd Autobody and Glass in Canada, and Gerber Collision and Glass in the United States. As you’ll see by the KPI chart above, the bulk of the business is in the United States, as the vast majority of its stores are Gerber.

The company’s strategy for many years has been multi-pronged. They not only utilize their free cash flow to open new stores, but they buy up mom-and-pop shops at discounts, rebrand them into Gerber/Boyd, improve the margin profile, and seamlessly merge them into the fold. It has done this for decades, which is why it has been one of the better compounders on the index up until some headwinds started hitting it over the last few years.

The collision repair market is one of the more fragmented markets in North America. The collision repair market in North America is estimated to be anywhere from $47B-$55B in 2025. Boyd currently generates $4.1B in revenue.

Boyd is the largest of its kind, yet it controls a single-digit portion of the market share. What exactly does this mean? It means there is plenty of runway for the company to continue to acquire shops in the future. There is little risk here that Boyd runs out of acquisition targets.

In fact, if the market remains soft over the short term, it may even accelerate their acquisition targets. As an industry leader that generates a large amount of cash flow, the company will be able to swoop in and buy up distressed mom-and-pop shops that are realizing some operational struggles. And it will likely get these shops at discounted rates. It says as much in their conference call to close out 2024:

“The other thing that we are seeing is, look, if the claims environment remains soft for a long period of time, that puts a lot more pressure on single shop and even some of the five to seven shop operators that are in the market. And that obviously that type of pressure if it’s prolonged will put many people in a position where their price expectation will start to change.”

The second core part of the thesis is the fact that the majority of Boyd’s revenue is generated from insurance companies. The vast majority of automobile collision reports will be done through insurance claims. As a result, the company should be able to continually generate a consistent stream of income from these insurers and also be able to negotiate costs much easier than with individual consumers, who will be much more reluctant to pay out of pocket for repairs if the costs are high.

The increasing complexity of modern vehicles is leading to higher repair costs, and also requires specialized expertise and equipment. This leads to more demand for repair shops as DIY repairs are becoming a thing of the past, aside from relatively basic maintenance.

The company recently issued its new five-year goals, which include growing revenue to $5 billion USD by 2029 from the current $3 billion USD and doubling Adjusted EBITDA to $700 million between 2024 and 2029. If Boyd can hit these numbers, it should lead to market-beating returns, as it represents a CAGR of around 15%.

Boyd’s previous long-term growth goal, aimed at doubling the size of the business on a constant currency basis from 2021 to 2025 compared to 2019 revenues (implying an average annual growth rate of 15%), faced some headwinds in 2024 and early 2025 due to challenging economic and industry conditions. However, I’m confident the company can hit its next 5-year goal, as it is likely we move into a more normalized environment, not one plagued by high inflation and auto tariffs.

Beta

0.3

Best monthly return

17.4%

Worst monthly return

-14.5%

Max drawdown

53.1%

A company that relies on growth via acquisition always runs a few risks. For one, if competition in terms of bidding enters the scene, purchasing the same properties becomes more expensive. In turn, this would drive downward pressure on Boyd’s return on investment, as it would have to pay more for the same opportunity.

Another risk with Boyd is that it relies heavily on 5 major insurers in the United States. These 5 companies made up nearly 55% of the company’s revenue in 2024. If Boyd were to lose one of these clients to another auto repair company, it would have a material impact on the company.

As we make further technological advancements, collision avoidance is at the top of many insurance and car manufacturing companies’ priorities. CCC, an industry leader in estimating collision repair, forecasts that technology will reduce overall accidents by 30% over the next 30 years. This can be a long-term issue for Boyd, a company that relies on accidents to drive revenue.

The company also faces headwinds when it comes to climate change. Last year was the warmest winter on record. Ultimately, the warmer the winter, the safer the driving conditions. This leads to lower collisions overall, which is what drives Boyd’s revenue.

As cars get more complex to fix, staffing requires more training, more certification, and ultimately higher wages. Boyd will have to work to offset these costs through higher charges to consumers and insurance companies, or this could hit margins.

Finally, an additional risk when it comes to acquisitions is using debt to finance those acquisitions in a higher-rate environment. The short-term impacts are hitting the bottom line nonetheless. An acquisition-heavy company relies on its management to make prudent decisions with capital and issue/pay down debt at critical intervals to drive earnings growth in any environment. Boyd has done this thus far, but it’s never guaranteed they’ll continue to do so.

TTM

Historical average

Forward numbers

P/E

434.8

89.6

84.0

EV/EBITDA

13.8

15.7

Free cash flow yield

6.5%

P/FCF

15.5

16.9

PEG ratio

1.2

Considering the highly fragmented nature of the industry, combined with the fact that Boyd generates a large amount of revenue from sources that are unlikely to be impacted by poor economic conditions, it has often traded at a premium valuation relative to its growth. Combine this with the fact that the company is still trying to work its way through difficulties regarding margins and weather-related headwinds, and on the surface, we have a company that looks expensive.

Due to its acquisition-heavy nature, Boyd has a lot of non-cash expenses on the income statement, like depreciation and amortization. As a result, it often always looks expensive on an earnings basis. What you need to be doing is valuing the company from an EV/EBITDA basis and a price-to-free cash flow basis, as this gives a better idea of the profitability of the company.

On a price-to-free-cash-flow basis, it sits at only 15x trailing cash flow. This is a high single-digit discount to the company’s typical price-to-free cash flow ratios. In terms of EV/EBITDA, the company is trading at a double-digit discount and is at a decade-long low in terms of valuations.

I viewed the company as a GARP (Growth At a Reasonable Price) play, but it’s now bordering on value. Cash flow generation is strong, margins are improving, and this should be able to drive growth.

If the company can execute on its 5-year plan and grow at a 15%~ annual pace, at the current valuations it trades at, this should lead to market-beating returns over the next 5 years.

Boyd has no publicly traded competitors, so there isn’t much need for a competitor analysis table. Its primary competition would be private autobody and auto glass shops across Canada and the United States.

Because the industry is so fragmented, it is hard to even identify any companies of Boyd’s size that have public data about cash flow generation. This company, in terms of publicly traded ones, is one of a kind in Canada.

Yield

0.3%

Payout ratio (EPS)

43.8%

5-year dividend growth %

2.2%

Money Spent/Received on Buybacks and Share Issuances

Boyd is a Canadian Dividend Aristocrat with 18 consecutive years of dividend growth. However, it will not be appealing from an income standpoint as the company only yields around 0.3% at the time of the update. There is also little growth from this company.

Despite having an 18-year dividend growth streak, the 5-year dividend growth rate is only 2%. Instead, it chooses to use excess capital to buy up autobody shops to fuel shareholders’ growth. Considering the industry is so fragmented, I’d expect this to be Boyd’s strategy for the foreseeable future. Expect low, single-digit dividend growth from Boyd as it continues to utilize capital to grow the business internally.

Last quarter

EPS

Revenue

Expectations

$0.89

$1.11B

Reported

$0.86

$1.10B

Surprise

-3.05%

-0.39%

Annual estimates

EPS

Revenue

2025

$2.70

$4.44B

2026

$5.59

$5.76B

2027

$7.82

$6.47B

Boyd’s recent quarter is a strong signal a turnaround in the auto market may be well underway, and the thesis is certainly well in motion. Revenue grew 5% year-over-year to $790 million, driven by a return to positive same-store sales at +2.4%, Boyd’s first comparable sales gain in quite some time. Last quarter the company had mentioned that it was likely same store sales would finally turn positive, and they did.

More importantly, the company is mentioning that momentum is continuing into the current quarter and that it should be stronger than Q3. This gives me the impression they will get back to their long-term targets of 3-5% same store sales growth. The backdrop helped, as industry headwinds that have plagued it for years eased. Repairable claims volumes improved sequentially, used car values stabilized, and insurance premium inflation began moderating.

Management mentioned that major carriers are starting to lower premiums in key markets like Florida, which they expect will improve consumer coverage levels and ultimately support higher claims frequency. All signs suggest the demand bottom is in, and that Boyd is turning the corner.

Margin expansion also stood out as a major win. Adjusted EBITDA jumped 22.8% to $98.4 million, with margins expanding 170 basis points to 12.4%. This was fueled by a few things. Improved parts margins, internalization of scanning and calibration services, and continued progress on Project 360, Boyd’s cost transformation program.

That initiative has already delivered $30 million in annualized savings, and management reaffirmed its trajectory toward $70 million by 2026 and $100 million by 2029. The margin narrative here is no longer a theoretical concept thrown around by Boyd. It’s starting to show up in the numbers.

But the headline from the quarter wasn’t in the core results. It happened just before the company reported earnings, and it was the announced acquisition of Joe Hudson’s Collision Center, a 258-location company with strong margins and a large footprint across the U.S. Southeast.

Boyd has long said it would wait patiently for the right large-scale deal, and Joe Hudson checked every box for them. The $1.3 billion deal, is expected to deliver $35–$45 million in synergies, with over half realized in the near term and the rest by 2028. With Joe Hudson historically operating at ~14.4% margins, the acquisition not only adds scale but is also margin accretive. This should push Boyd’s consolidated margin profile closer to its own five-year 14% target faster than expected. The company is planning to fund the acquisition via some share offerings in the US, which will now make it listed on US markets. Leverage ratios have ticked up higher, but the company sees a path back to normal ratios by the end of 2026.

Outside of the Joe Hudson acquisition, network growth remains steady. Boyd added 24 new locations, 17 from tuck-in acquisitions and seven start-ups, including its first entry into Nova Scotia.

There was a drastic shift in tone from management on the call. They now seem upbeat and optimistic, whereas in the last few years it was clear that industry headwinds was weighing on the company. If the next 12 months deliver on same-store growth, margin improvement, and Hudson integration, Boyd could be entering a multi-year stretch of operating leverage.

Disclaimer

By utilizing this report, you agree that you are a Stocktrades Premium member, and you agree to our terms and conditions and privacy policy. You acknowledge that any distribution of this report outside of Stocktrades Premium could result in the immediate cancellation of your Premium subscription. You also agree to the following:

This stock report is solely for informative purposes, and does not represent a buy or sell recommendation. The information expressed in this report is the opinion of the analyst about the subject company and our database of stocks in general. The information the analyst used to compile this report comes from sources we believe are reliable. Stocktrades Ltd however makes no warranties of any kind as to the completion or correctness of the information within this document.

All information in this report is accurate as of the date of this report, and all data contained within this report of the subject company is of the analyst’s best judgement at the date of the report. The information contained in this report is subject to change without notice. The information provided in this report is provided for informational purposes by Stocktrades Ltd and Stocktrades Ltd assumes no legal responsibility or liability. Anyone using this report assumes full responsibility for whatever decision is arrived at by using the details of this report.

Stocktrades Ltd. assumes no liability or legal responsibility for the resulting actions and or consequences of using outdated information. No version of this report outside of the original located at www.stocktrades.ca/premium/ is to be considered to contain live, or accurate information. These reports are updated quarterly and it is the users responsibility to insure they have the most recent updated version.

You may not alter or distribute this report in any way without the full consent of Stocktrades Ltd.

The decision to purchase or sell of a security depends on a multitude of individual factors such as but not limited to risk tolerance, financial situation, and investment objectives.