[]
Login Join Premium

Bull List Report – TMX Group Ltd TSE:X

TMX Group Ltd. – X.TO

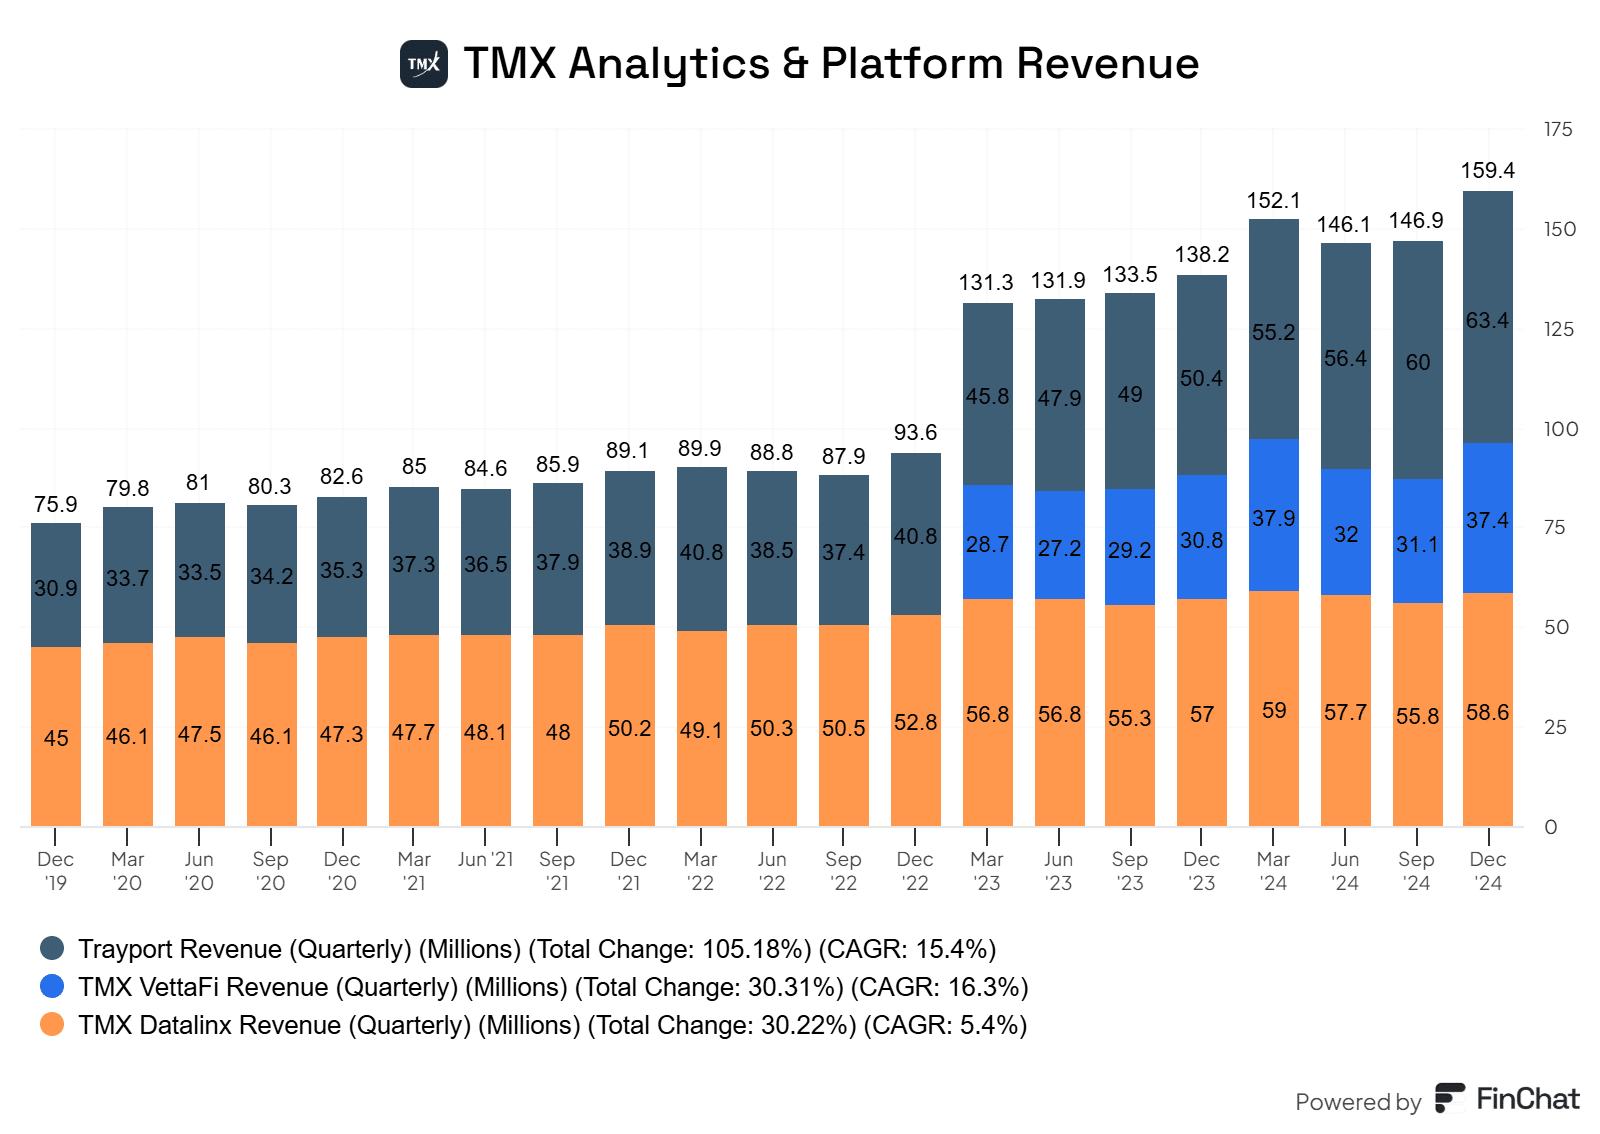
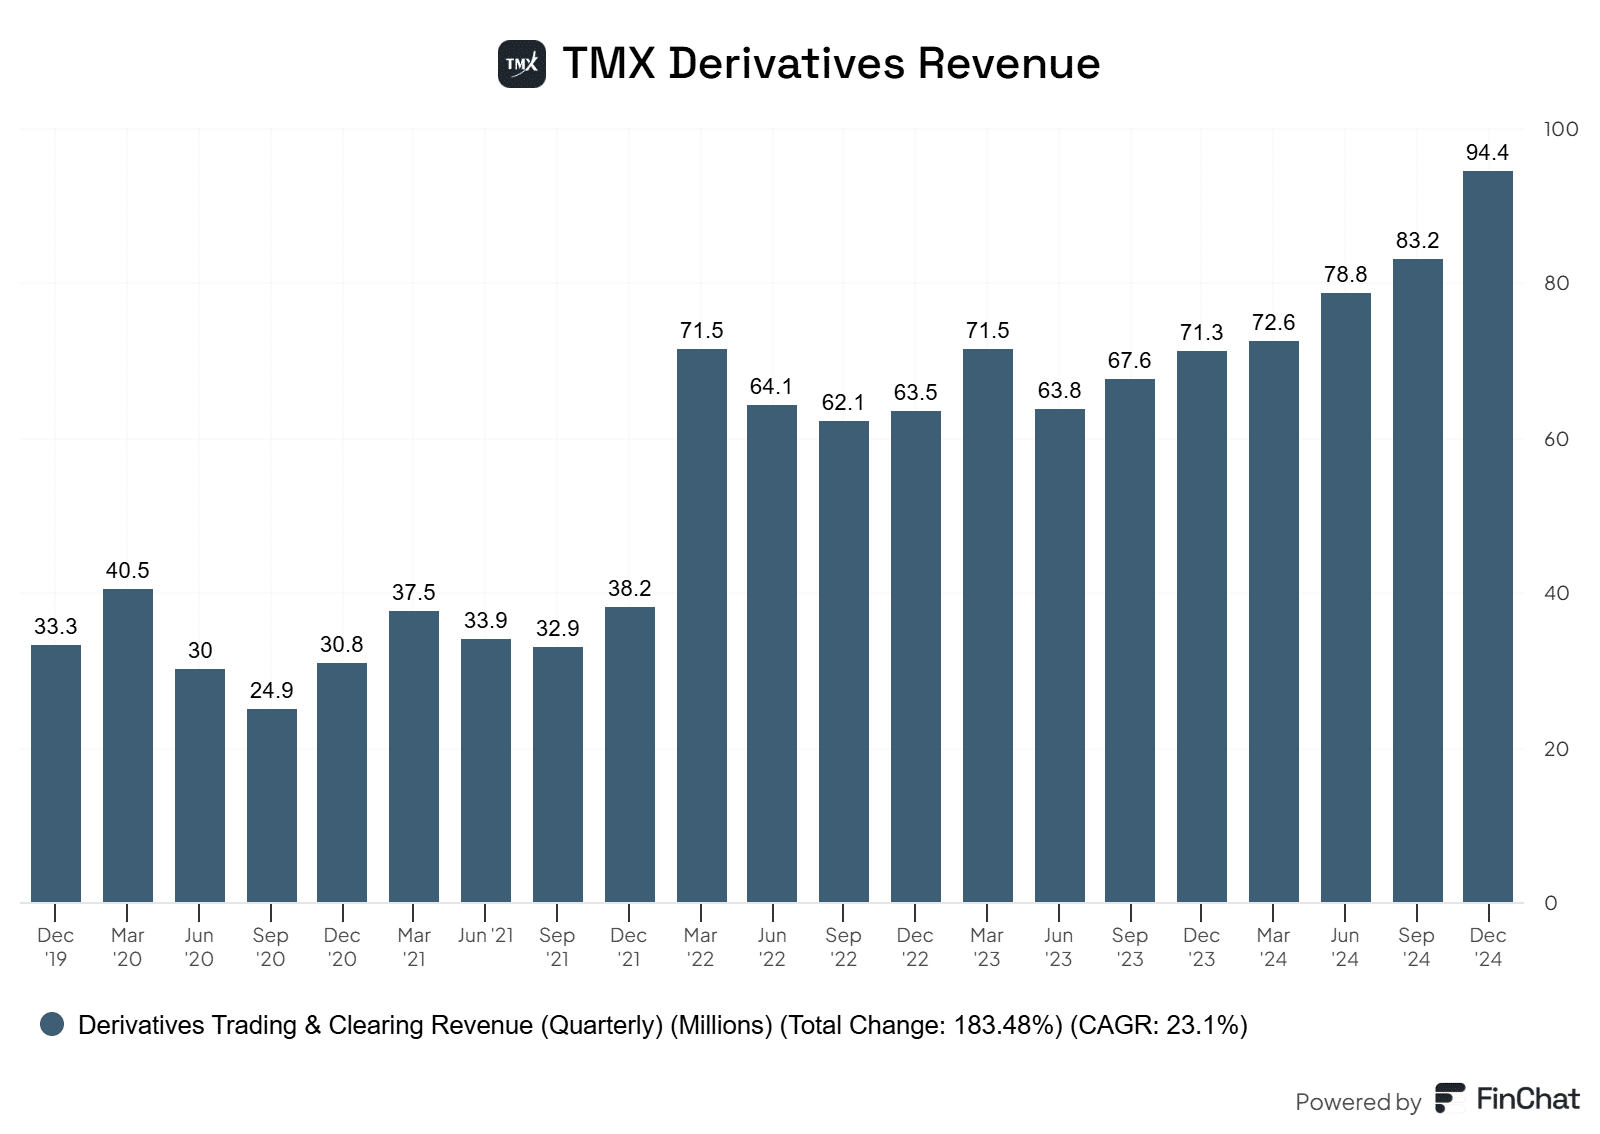
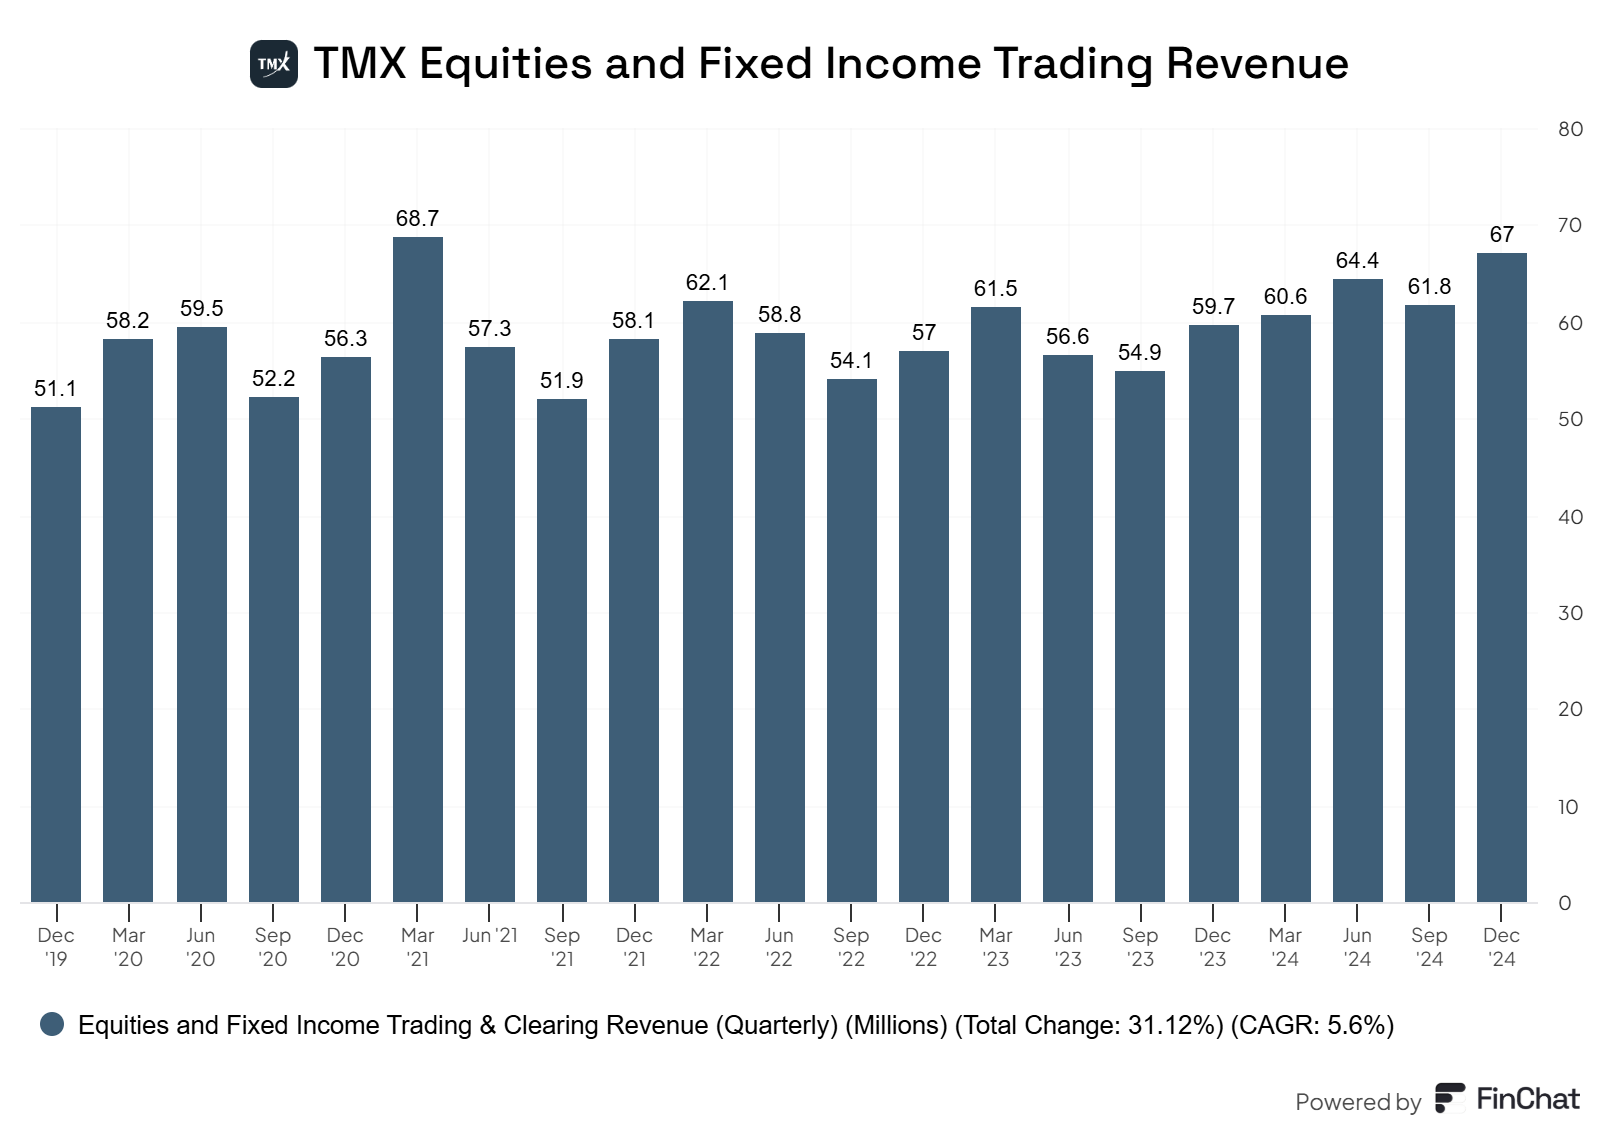
TMX Group Ltd is a company that operates several markets to provide investment opportunities for its clients. TMX Group provides listing markets, trading markets, clearing facilities, depository services, technology solutions, data products, and other services to the world-wide financial community. TMX Group operates offices across North America (Montreal, Calgary, Vancouver, and New York), as well as in key international markets including London and Singapore. The company has four segments namely: Global Solutions, Insights & Analytics, which derives the key revenue; Capital Formation; Derivatives Trading & Clearing; and Equities and Fixed Income Trading & Clearing.

Focus area

Score

Valuation

48

Profitability

42

Risk

96

Returns

78

Dividend

78

Outlook

65

Debt

44

Growth

87

Overall

62

Click the KPI images to expand them if needed!

Pros

  • Significant moat – the largest exchange in the country
  • Achieved Canadian Dividend Aristocrat status in 2021. Has since extended its dividend growth streak to 9 years
  • Excellent payout ratios – plenty of room for continued dividend growth
  • Respectable growth in the high single-digits
  • Has consistently outperformed the S&P/TSX Composite Index
  • Has raised the dividend three times in the last 2 years
  • A consistent and reliable performer, especially considering current market conditions
  • Company is benefitting substantially from active and renewed interest in equity markets

Cons

  • Market volatility and higher policy rates have resulted in lower IPOs over the last few years
  • Increased competition from the Cboe (formerly NEO Exchange), the only other senior exchange in Canada, which is now starting to target corporate listings
  • Valuations are now pricing in higher growth, and the company will need to keep up with high expectations

The TMX Group has a considerable moat that is unlikely to be impacted meaningfully despite the emergence of the NEO Exchange. TMX has little competition and remains the preferred exchange for most companies that want to go public.

The pandemic also increased retail interest in the markets. Yes, it has died down because of some rough economic circumstances for Canadians, but as policy rates come down and the markets are at all-time highs, there is renewed interest.

The more market activity for TMX Group, the better. We can see in the KPI charts above that equity, fixed income, and derivative revenues are increasing as market activity accelerates, and this is directly impacting earnings and sales in a good way. We can expect this company to be cyclical relative to market activity, but considering the markets are typically in a bullish state and attracting more capital much more often than not, this is a strong proposition for TMX Group being a long-term core holding in a portfolio.

The company has flown under the radar as a reliable income stock. I think this will eventually change with its inclusion on the Aristocrat list. The company offers an attractive combination of yield and dividend growth with earnings growth at reasonable values, considering the circumstances.

The company has a nice mix of growth through acquisitions and has managed to achieve strong organic growth in the high single to low double-digits over the past handful of years. That trend is expected to continue over the next couple of years. The company is quietly posting good results and doing its thing. Nothing to get excited about, but it has proven to be a reliable stock to own.

Overall, the main thesis surrounding TMX Group is its economic moat in regard to major exchanges in Canada, the consistent inflows and market activity on the major stock indexes, and the fact that the company is able to acquire and integrate key systems into its platform, like Trayport, to drive future revenue and earnings growth.

The company is also a low-beta option that typically has lower max drawdowns than the index, making it a suitable holding for those with lower tolerance for risk.

Beta

0.0

Best monthly return

14.7%

Worst monthly return

-6.9%

Max drawdown

13.3%

A significant portion of the company’s revenue comes from trading, which is highly sensitive to macroeconomic conditions. Given that Canada is also the largest geographic concentration of revenue it is subject to domestic macroeconomic factors such as GDP growth, regulations, interest rates, volatility, and market activity, all impacting business.

The weaker the Canadian consumer and potentially even Canadian corporations, the lower market activity we can expect to see. Although the company is currently producing exceptional results despite some rough economic circumstances in Canada, it is not guaranteed to do so in the future.

The risks are not only limited to Canada. Geopolitical issues globally will impact trading and capital raise volumes. We saw how the Russia/Ukraine war affected some companies that had been materially impacted by sanctions on Russia.

This can lead to delayed or cancelled raises or IPOs, etc. While exchange competition is limited (in Canada at least), it still competes globally with other exchanges for global listings and if it is not competitive, the company can lose business to other more notable exchanges.

Finally, since the Canadian economy is heavily exposed to natural resources and energy-related businesses, the TMX Group is exposed to downturns in these sectors as they can impact capital formation and trading and clearing activities.

TTM

Historical average

Forward numbers

P/E

33.4

24.7

25.1

EV/EBITDA

17.8

15.1

Free cash flow yield

4.0%

P/FCF

24.8

22.3

PEG ratio

1.5

The initial addition of TMX Group to my Dividend Bull list was based on the fact it traded at what I viewed as a discounted valuation. The value gap has closed on this company as it now trades at double-digit premiums on a price-to-earnings, free cash flow, and EV/EBITDA basis.

However, I decided to keep TMX on the Bull List, and I am happy I did. Why did I keep the company on the list despite a change in thesis? Primarily because I felt the company shifted from a value play to a GARP (Growth at A Reasonable Price) play. TMX is not cheap. However, the accelerated growth from the company due to strategic acquisitions paying off, like Trayport, plus the resurgence in activity in the markets, has resulted in higher than average growth.

The company’s 5-year historical averages, which is what would be displayed above, would have some elements of the market drawdown in those valuations when TMX was trading at a discount. So, although on the surface it looks like it is trading at large premiums to historical averages, I think those historical averages are underrepresented due to discounted valuations previously, plus the fact the company is simply growing much faster than it used to.

I expect the company to grow in line with earnings growth at this point in time, and it has gone from a company that typically provided high single-digit growth to a company that can consistently grow at a double-digit pace. The company’s margin profile (65% gross margins and 43% operating margins) puts it up there with the big tech companies south of the border, and it’s nice to see the market finally rewarding this outstanding company.

You aren’t getting a bargain anymore, that is for certain. However, high quality commands command high valuations.

TMX (X)

CBOE (CBOE)

Nasdaq Inc (NDAQ)

Operating Margins

24.8%

29.0%

28.4%

5-year revenue growth

20.7%

10.4%

11.7%

5-year EPS growth

14.6%

16.7%

4.5%

5-year annualized return

13.5%

23.9%

15.5%

Forward P/E

25.1

24.2

25.9

TMX has no publicly listed competitors on the Canadian exchange. However, due to the NEO exchange being acquired by CBOE, which is a company that owns the Chicago Mercantile Exchange (CME), Chicago Board of Trade (CBOT), and New York Mercantile Exchange (NYMEX), I have included them as potential competitors.

TMX group has the better margin profile and has produced better sales growth over the last 5 years. Because of the valuation gap that existed with TMX Group over the last half-decade or so, 5 year annualized returns have been higher over a company like CBOE.

When we look to the NASDAQ, although it has a lower margin profile, it has produced larger returns, returns on invested capital, and similar earnings growth. However, it is relatively difficult for a company like TMX to keep up with a high-flying index like the NASDAQ, especially during the significant bull run we’ve had in technology stocks.

Overall, TMX is the most expensive company out of the three. However, it is also one of the faster growing and also faces the lowest amount of competition overall.

Yield

1.6%

Payout ratio (FCF)

38.2%

5-year dividend growth %

8.3%

Money Spent/Received on Buybacks and Share Issuances

-$11.2M

Regarding the safety of the dividend, TMX Group ranks among the best. Looking at the dividend against earnings, free cash flow, or operational cash flow, you can see that the dividend is well covered.

Cash flow ratios come between 30-40%, while the payout ratio against earnings is only 45%. This should give investors confidence that the company can handle an adverse event. Its payout ratio in terms of earnings has continued to drop for nearly 3 years straight. This highlights the fact that one-off charges and market-driven headwinds are subsiding. In December 2020, the company’s payout ratio was in the 55-57% range.

Furthermore, the company has consistently grown earnings and cash flows year-over-year, so the payout ratios will likely remain stable even with future raises.

TMX Group has consistently grown its dividend on an annual basis. However, the company has been making smaller, more frequent hikes to the dividend. It raised the dividend in February 2023, August 2023, May 2024, January 2025, and finally in August of 2025.

In terms of buybacks, the company has been a relatively consistent repurchaser of shares over the last half decade. However, it does occasionally issue shares to fund acquisitions. Although share counts have been accelerating recently, the company has started to buy back shares in recent quarters, likely due to excess cash flow generation.

Last quarter

EPS

Revenue

Expectations

$.49

$409M

Reported

$0.52

$418M

Surprise

5%

2.3%

Annual estimates

EPS

Revenue

2025

$2.01

$1.67B

2026

$2.25

$1.79B

2027

$2.49

$1.91B

TMX continues to deliver exceptional quarters. This is the company’s fifth consecutive quarter of double-digit revenue growth and the diversity of the business away from strictly an index provider is now starting to show.

Revenue increased 18% year-over-year and earnings increased by 27%. Across the board, each business line is contributing, and management continues to execute its plan to get to $2B in revenue in 5-7 years. I would not be shocked whatsoever if they manage to hit this target earlier.

Derivatives and clearing remains the most impressive segment of the business right now, and considering the market speculation, I’m not surprised it is doing well. Revenue in that segment jumped 27%, fueled by a 31% increase at the Montreal Exchange, which is an exchange primarily used for derivatives. If you want to get an idea of how popular options are on the markets these days, open interest surged to a record 33 million contracts in September, up 57% from a year ago.

Equities and fixed income trading delivered a more inline level of growth I’d say, with trading revenue up 10% and clearing revenue up 2%. Trading volumes were strong on TSX Venture, which saw an 86% increase versus last year, which again highlights some extended speculation in the markets right now that TMX is taking advantage of.

The main story here and one of the main drivers of growth is the company’s Global Insights segment, which includes TMX VettaFi, Trayport, and Datalinks. I had mentioned above this company is diversifying away from just being an exchange company and instead is expanding into data. These are those growth verticals.

Global Insights saw revenue grow 18%. VettaFi led the way with 21% organic growth. Trayport revenue rose 16% in CAD, with recurring revenue up 18%, reflecting the growing demand for energy trading analytics, despite energy prices being in the gutter. Datalinks grew by 12% due to a combination of new pricing but also higher adoption.

I am going a bit more in-depth here as this segment is critical for TMX’s future. These are the higher margin, recurring revenue, and lower cyclicality businesses that are driving its higher valuations at this point in time. Acquisitions like Verity, a buy-side research management and analytics platform, kind of highlight that the company is not slowing down on this end of the market anytime soon.

On the listing side of things, listing fees climbed 42% and the listing pipeline looks stronger, with plenty of additional listings waiting. My only hesitancy here is the large quantity of mining listings. If we see precious metals take a step back, this segment might also take a step back. A prime example? Equity financings by TSX Venture issuers were up 67% year-to-date.

Strategically, the company is threading the needle between growth and stability almost perfectly. As mentioned, it is leaning harder into data and analytics, pushing international expansion, and leveraging platforms like Trayport and VettaFi to build more recurring, scalable businesses.

This is without question a company that has an economic moat, and is currently flexing it to post outsized growth elsewhere.

The company is no longer just about Canadian trading volumes or listings. It’s quietly building a broader platform, one that spans data, analytics, index licensing, and energy infrastructure.

Disclaimer

By utilizing this report, you agree that you are a Stocktrades Premium member, and you agree to our terms and conditions and privacy policy. You acknowledge that any distribution of this report outside of Stocktrades Premium could result in the immediate cancellation of your Premium subscription. You also agree to the following:

This stock report is solely for informative purposes, and does not represent a buy or sell recommendation. The information expressed in this report is the opinion of the analyst about the subject company and our database of stocks in general. The information the analyst used to compile this report comes from sources we believe are reliable. Stocktrades Ltd however makes no warranties of any kind as to the completion or correctness of the information within this document.

All information in this report is accurate as of the date of this report, and all data contained within this report of the subject company is of the analyst’s best judgement at the date of the report. The information contained in this report is subject to change without notice. The information provided in this report is provided for informational purposes by Stocktrades Ltd and Stocktrades Ltd assumes no legal responsibility or liability. Anyone using this report assumes full responsibility for whatever decision is arrived at by using the details of this report.

Stocktrades Ltd. assumes no liability or legal responsibility for the resulting actions and or consequences of using outdated information. No version of this report outside of the original located at www.stocktrades.ca/premium/ is to be considered to contain live, or accurate information. These reports are updated quarterly and it is the users responsibility to insure they have the most recent updated version.

You may not alter or distribute this report in any way without the full consent of Stocktrades Ltd.

The decision to purchase or sell of a security depends on a multitude of individual factors such as but not limited to risk tolerance, financial situation, and investment objectives.