If you remember last months piece of Premium content, we went over the Relative Strength Index (RSI) and how you could use it to time particular entry and/or exit points.
That piece was so popular, members wanted us to expand on other technical indicators. And while we don’t use very many here at Stocktrades Premium or even in our own portfolios, we do tend to using both RSI’s and Moving Averages to time entries (or additions) for our Bull List.
So, in this piece we’re going to not only explain what a moving average is, but show you some charts and price actions that signal that moving averages can be a solid indicator of a change in price trends.
So with that, lets get started.
What exactly is a moving average?
The moving average is a very simple technical indicator, however a lot of websites definitions tend to get muddy, and confusing.
Simply put, the moving average takes a stocks average price over a particular period of time. It’s really that easy.
If you took the end balance of your bank account every day for the past 30 days, you’d be able to construct a moving average for the money in your chequing account in a very simple formula.
It’s simply the total of your ending balances, divided by the number of days. So, lets make it even easier so we can show an example.
Bank account balances:
Day 1: $3050
Day 2: $2922
Day 3: $2700
Day 4: $2500
Day 5: $3900
Your 5 day moving average = 3050+2922+2700+2500+3900/5 or $3014.4.
This type of moving average is what we’d call a simple moving average. There is another moving average called the exponential moving average, however it’s not an indicator we use here at Stocktrades at all.
Why? Well, the exponential moving average places more emphasis on recent price changes. It’s a good indicator for short term trades, but as long term investors who are trying to determine long term trends, we want to stick to simple moving averages.
So how can I use the moving average?
A moving average can be used for multiple things.
For one, it’s easy to look at a stock chart and see something like this:
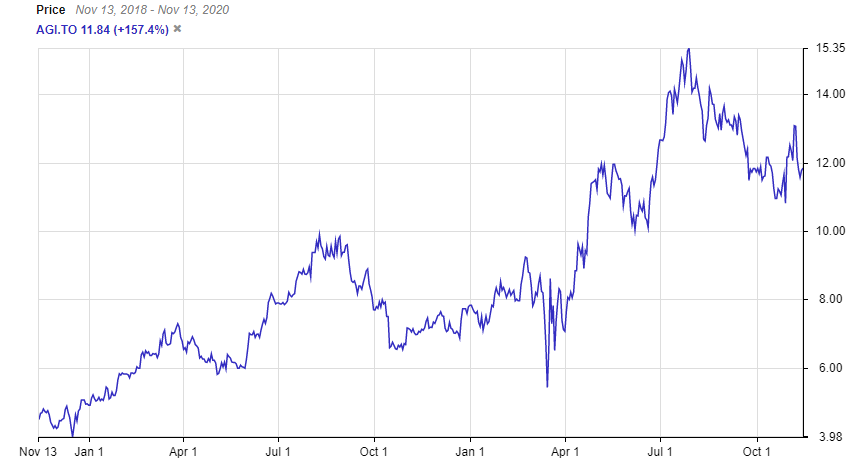
We can see a bunch of jittery price movements, ups and downs. There will be some points on this chart where we see price fluctuations of 5%+ in very little time. However, once we add the 50 day moving average in, we can “smooth” this chart out, and get a more accurate representation of the trend of Alamos Gold.
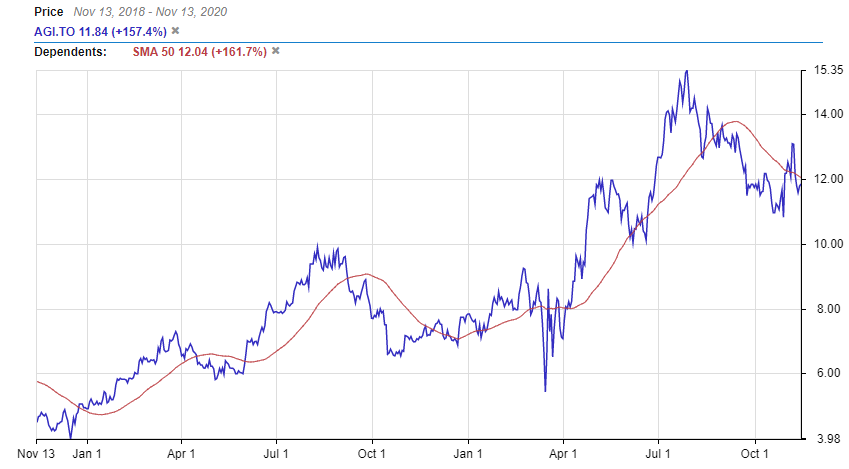
And using the same company (Alamos Gold AGI.TO), we can change the chart to year to date and find another use for the moving average in the chart below:
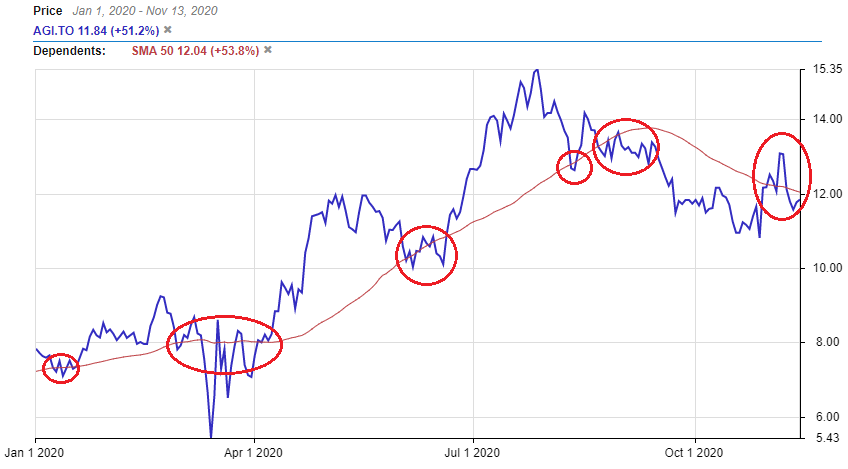
The above chart shows the 50 day moving average for Alamos Gold.
Moving from left to right, in the first instance we can see Alamo’s stock price flirts with it’s 50 day moving average, but continues normal price action for another month or so.
In the second instance, the stock bounces off its 50 day moving average, goes up but then finally breaks through on the second test and we can see a significant drop in price and a month or so of extreme volatility with the stock. However, in this same instance, once it breaks back through the moving average going up, it goes on a significant bull run for a couple months.
In the third instance, after the bull run, we can see that the price of Alamos tests its moving average, which is trending up in a big way, twice in a short duration of time. Both times it very momentarily crosses the average before bouncing back and continuing its bull run.
We can see a very similar situation in the fourth instance, but as we can see in the fifth instance, once it crosses below the 50 day moving average and fails to recover in any sort of meaningful way, it triggers a sell off, which Alamos as been on for some time now.
In our final instance, we see that Alamos has crossed its 50 day moving average but has slightly dipped below again. This could be a sign of a trend reversal.
So what to take from all of this? Essentially a moving average line can act as a type of support and resistance indicator. In a stock uptrend, the stocks price will typically go down, bounce off the moving average and head upwards. In a stock downtrend, the price will go down and on rebounds the moving average will tend to act as resistance.
The longer the moving average, the fewer reversals you’ll see
At minimum, I use the 50 day moving average to look a a trend in a stocks price. Using anything fewer would benefit a trader, but as a long term investor looking to see if an entry point is optimal at this time, you’re better off using longer moving averages.
Why? Well, the shorter the moving average, the more you’ll see a stock cross its moving average.
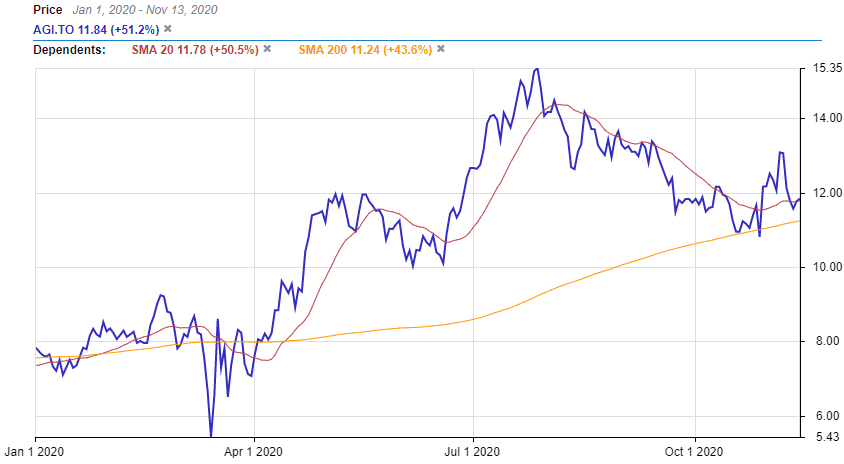
This is a year to date chart of Alamos Gold with its 20 day moving average (brown) and its 200 day moving average (yellow).
As we can see, throughout the year its stock price has broke its 20 day moving averages a lot. Whereas with the 200 day moving average, it broke it once at the beginning of the year, and just recently bounced off of it if you look to the far right portion of the chart.
A stock crossing its 200 day moving average is a much, much stronger signal for a trend reversal than say a 20 day moving average, and is one of the main reasons I tend to stick to longer averages.
It is highly likely if Alamos were to have crossed its 200 day moving average, we could have witnessed an even steeper fall in price.
Stocks testing moving averages
The moving average can be somewhat complex in the fact that a stock crossing it in either direction doesn’t immediately indicate a buy signal.
A stock near a moving average can enter what technical analysts call a “whipsaw” pattern, which can be wild fluctuations in either direction. The stock can periodically cross the moving average in either direction, and a trend reversal is never really clear.
I tend to wait these situations out. I don’t mind losing or gaining a bit of capital to be able to clearly identify potential price movement, rather than jump right in during volatile price movements.
How can you use moving averages to time entries?
The moving average is a “lagging” technical indicator. This means that before the moving average changes, the price has to change before.
Optimally, if we’re looking to use the moving average to enter a position to take advantage of a trend, we want to see two things:
- The stocks price is above its moving average
- It’s moving average is heading upwards, the steeper the better
This is a very basic technical indicator, and one that should never replace long term fundamental analysis. However, we’re not completely oblivious to the fact that although underlying fundamentals of a company could be strong or weak, its price action does not necessarily follow this.
A company can be fundamentally strong, but if it crosses its 200 day moving average, it is a sign that further negative price action is coming. As a result, investors may be wise to hold off on a position.
The opposite is true as well. A company that is fundamentally weak crossing a 50 or 200 day moving average can signal an uptrend in price.
As long term fundamental investors, we’d suggest avoiding these situations as we have to remember we’re purchasing companies, not just tickers.
However, we do understand that it is in our nature to speculate somewhat, it’s just important to do it with capital you don’t mind losing. The core of your portfolio should be purchases made due to long term prospects of a company.
As per when you enter positions in those companies however, the moving average and relative strength index can be your guide. These technical indicators are not 100%, and there will be times where you think an entry is timed perfectly and it continues to go the opposite way.
But, they provide somewhat of a structure for entries and/or exits, and are used by many investors.