
Suppose you’re looking for the best dividend stocks to add to your TFSA or RRSP today. In that case, you need to look at Canadian Dividend Aristocrats.
Canadian Dividend aristocrats are famous, especially to newcomers looking to learn how to buy stocks.
What is a Canadian Dividend Aristocrat?
For a Canadian company to become a Canadian Dividend Aristocrat, it needs to meet the following criteria:
- A market cap of at least $300 million
- The company has increased the dividend for five consecutive years
- Must be listed on the Toronto Stock Exchange and a member of the S&P Canada BMI
A US-listed company must have raised dividends for 25 straight years to be considered a Dividend Aristocrat in the United States.
If we used this criterion to classify Canadian stocks as Dividend Aristocrats, the list below would be trimmed from 88 companies to 11.
And if we were to take it a step further to classify Dividend Kings, which are US-listed companies that have raised dividends for 50 consecutive years, there would only be one stock on the list, which is Canadian Utilities.
How many Dividend Kings are there?
There are 48 Dividend Kings in the United States, meaning 48 publicly listed companies have increased their dividends for 50 consecutive years or longer.
What are the highest-paying Dividend Kings?
At the time of writing, you will see Altria (MO), 3M Company (MMM), Canadian Utilities (CU), Leggett & Platt (LEG) and Universal Corporation (UVV) with the highest dividend yields.
As stock prices change daily, checking which Dividend Kings have the highest payouts is essential when reading this article.
What are the Canadian Dividend Kings?
Canadian Utilities is the only, and first in Canada’s history, Dividend King. This means Canadian Utilities has raised the dividend by 50 consecutive years or longer. However, we expect Fortis to hit that goal next year, as its streak currently sits at 49 years.
Who should invest in Canadian Dividend Aristocrats?
Because we’re talking about consecutive years of dividend increases, dividend growth investors will naturally gravitate toward aristocrat stocks. Of note, they also love monthly dividend payers.
A stock with a long growth streak and low dividend payout ratios has typically provided compounding dividend growth to those who’ve invested in it. The longer the growth streak, the more likely the company will continue its growth.
These growth streaks and a low payout ratio to support even further dividend growth come into play heavily when making investment decisions, especially for those who want a consistent and growing dividend payment in retirement.
If you’re looking at growth or value investing, you may not find much use for this list.
However, some strong dividend growth stocks have also provided exponential growth in stock appreciation and even a high yield to Canadian investors over the years; one, in particular, is Goeasy Limited (TSX:GSY).
Is there an ETF that tracks the Dividend Aristocrats?
Suppose you’re not into picking individual stocks but want exposure to some of the best Canadian dividend stocks. In that case, you’ll want to take a look at the iShares S&P TSX Canadian Aristocrats Index (TSX:CDZ). This aristocrat ETF has a total of 96 stock holdings.
Just understand that it will cost management fees of approximately $6.60 per $1000 invested annually to own it. Of note, these expenses are factored into the return chart below.
At the time, some of its top holdings contain small cap construction company Aecon (ARE), Fiera Capital (FSZ), Chartwell Retirement Residences (CSH.UN), Great-West Lifeco (GWO), and Power Corporation of Canada (TSE:POW).
Canadian Dividend Aristocrat performance vs the Index
Many investors want to know whether they will outperform the market if they purchase Aristocrats.
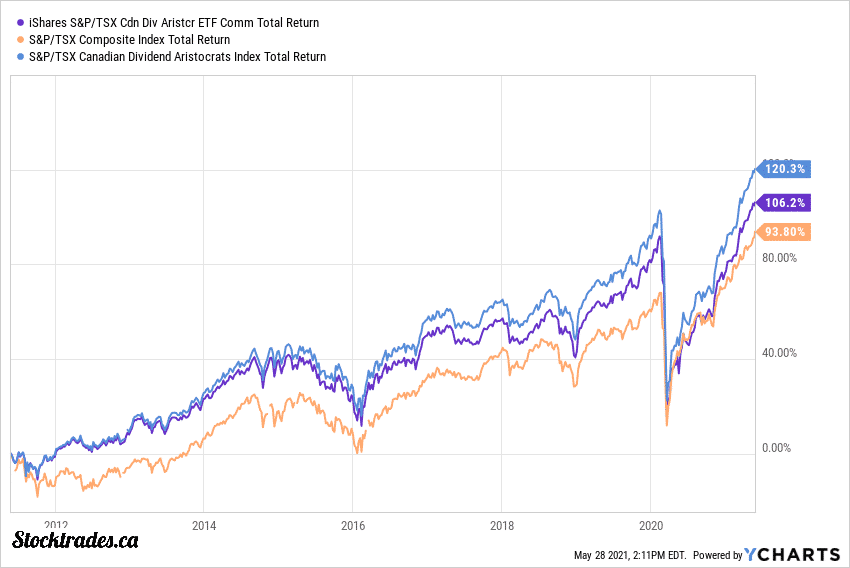
To compare whether or not dividend aristocrats here in Canada outperform the Toronto Stock Exchange, let’s look at the past performance since the inception of this TSX Canadian Dividend Aristocrats ETF and compare them to the Index itself.
At the time of update, over the last five years it has clearly been more advantageous to pick individual Canadian Dividend Aristocrats over buying the Aristocrat ETF.
Canadian Dividend Aristocrats by sector
Industrial and financial stocks comprise the bulk of the TSX Index (over 43%.) As such, when looking at this dividend aristocrats list, you’ll notice that most companies are in one of these sectors.
Oil and financial companies have struggled over the last year due to worries of a recession and economic downturn. As a result, prices are much lower than we witnessed in 2021.
As a result, Canadian Dividend Aristocrats could outperform moving forward in 2023, particularly those focused on the energy and financial sectors. These sectors tend to generate strong earnings, consistent cash flow, and high dividend yields.
But with all that being said, let’s get to our complete list of Canadian Dividend Aristocrats.
Canadian Dividend Aristocrats List
As always, if we’ve missed any companies on this Canadian Dividend Aristocrats list or you feel there is an issue in the data, please e-mail us.
| wdt_ID | Symbol | Market Cap | Payout Ratio | DGR Streak | 5 Year Div Growth | Yield | Sector |
|---|---|---|---|---|---|---|---|
| 1 | CU.TO | 7,755.00 | 83.56% | 51 | 4.44% | 6.25% | Utilities |
| 2 | FTS.TO | 25,093.00 | 50.67% | 49 | 5.96% | 4.57% | Utilities |
| 3 | TIH.TO | 9,091.00 | 25.43% | 33 | 15.47% | 1.55% | Industrials |
| 4 | CWB.TO | 2,712.00 | 41.60% | 31 | 5.58% | 4.69% | Financial Services |
| 5 | ACO.X.TO | 3,900.00 | 53.52% | 29 | 7.11% | 5.53% | Utilities |
| 6 | TRI.TO | 78,257.00 | 76.67% | 29 | 3.24% | 1.60% | Industrials |
| 7 | EMP.A.TO | 9,239.00 | 22.77% | 28 | 9.46% | 1.98% | Consumer Defensive |
| 8 | IMO.TO | 48,870.00 | 16.92% | 28 | 18.30% | 2.39% | Energy |
| 9 | MRU.TO | 16,205.00 | 28.19% | 28 | 11.37% | 1.72% | Consumer Defensive |
| 10 | CNR.TO | 96,432.00 | 38.73% | 27 | 12.17% | 2.15% | Industrials |
| 11 | ENB.TO | 95,757.00 | 179.47% | 27 | 7.35% | 7.88% | Energy |
| 12 | SAP.TO | 12,003.00 | 31.73% | 25 | 2.71% | 2.61% | Consumer Defensive |
| 13 | CNQ.TO | 95,948.00 | 69.68% | 22 | 23.03% | 4.10% | Energy |
| 14 | TRP.TO | 46,710.00 | 265.97% | 22 | 7.57% | 7.96% | Energy |
| 15 | CCL.B.TO | 10,129.00 | 28.33% | 21 | 22.71% | 1.86% | Consumer Cyclical |
| 16 | FTT.TO | 5,848.00 | 25.57% | 21 | 4.60% | 2.50% | Industrials |
| 17 | RBA.TO | 15,489.00 | 186.33% | 20 | 8.90% | 1.72% | Industrials |
| 18 | CCA.TO | 2,797.00 | 33.08% | 19 | 10.39% | 4.94% | Communication Services |
| 19 | T.TO | 32,094.00 | 105.43% | 19 | 6.60% | 6.56% | Communication Services |
| 20 | CGO.TO | 769.00 | 56.08% | 18 | 12.95% | 6.30% | Communication Services |
| 21 | IFC.TO | 35,311.00 | 57.12% | 18 | 9.34% | 2.22% | Financial Services |
| 22 | SJ.TO | 3,790.00 | 19.54% | 18 | 12.70% | 1.41% | Basic Materials |
| 23 | BYD.TO | 5,186.00 | 12.70% | 16 | 1.99% | 0.24% | Consumer Cyclical |
| 24 | EMA.TO | 12,946.00 | 41.32% | 16 | 4.66% | 5.82% | Utilities |
| 25 | ENGH.TO | 1,657.00 | 50.94% | 16 | 18.13% | 2.94% | Technology |
| 26 | BIP.UN.TO | 18,286.00 | 332.45% | 15 | 4.45% | 5.19% | Utilities |
| 27 | FNV.TO | 34,825.00 | 31.98% | 15 | 7.10% | 1.01% | Basic Materials |
| 28 | TCS.TO | 411.00 | 131.21% | 15 | 8.83% | 1.07% | Technology |
| 29 | BCE.TO | 47,302.00 | 144.38% | 14 | 5.10% | 7.46% | Communication Services |
| 30 | ATD.TO | 66,641.00 | 15.66% | 13 | 22.42% | 0.81% | Consumer Cyclical |
| 31 | BEP.UN.TO | 8,524.00 | -753.56% | 13 | 0.56% | 6.18% | Utilities |
| 32 | LGT.B.TO | 776.00 | 14.82% | 13 | 6.52% | 0.86% | Industrials |
| 33 | MG.TO | 20,830.00 | 54.93% | 13 | 10.39% | 3.42% | Consumer Cyclical |
| 34 | NA.TO | 30,517.00 | 44.15% | 13 | 9.44% | 4.52% | Financial Services |
| 35 | WCN.TO | 46,984.00 | 30.38% | 13 | 13.61% | 0.76% | Industrials |
| 36 | AQN.TO | 5,538.00 | -149.76% | 12 | 8.91% | 7.29% | Utilities |
| 37 | BNS.TO | 73,381.00 | 66.18% | 12 | 5.89% | 6.96% | Financial Services |
| 38 | CM.TO | 48,447.00 | 51.89% | 12 | 5.18% | 6.64% | Financial Services |
| 39 | CTC.A.TO | 8,167.00 | 44.00% | 12 | 17.61% | 4.72% | Consumer Cyclical |
| 40 | DOL.TO | 26,452.00 | 7.64% | 12 | 8.57% | 0.29% | Consumer Defensive |
| 41 | EQB.TO | 2,845.00 | 16.43% | 12 | 20.56% | 2.02% | Financial Services |
| 42 | GCG.A.TO | 1,101.00 | 5.18% | 12 | 24.57% | 3.16% | Financial Services |
| 43 | RY.TO | 165,618.00 | 42.24% | 12 | 7.34% | 4.55% | Financial Services |
| 44 | TD.TO | 148,866.00 | 42.48% | 12 | 8.66% | 4.69% | Financial Services |
| 45 | TFII.TO | 14,967.00 | 17.12% | 12 | 13.80% | 1.08% | Industrials |
| 46 | BMO.TO | 82,116.00 | 37.03% | 11 | 8.85% | 5.13% | Financial Services |
| 47 | FN.TO | 2,138.00 | 70.26% | 11 | 5.26% | 6.73% | Financial Services |
| 48 | L.TO | 36,509.00 | 26.54% | 11 | 8.11% | 1.55% | Consumer Defensive |
| 49 | STN.TO | 9,779.00 | 13.55% | 11 | 7.57% | 0.89% | Industrials |
| 50 | WN.TO | 20,772.00 | 24.04% | 11 | 7.41% | 1.82% | Consumer Defensive |
| 51 | BAM.TO | 17,727.00 | - | 10 | - | 3.82% | Financial Services |
| 52 | BN.TO | 69,576.00 | 275.18% | 10 | 8.48% | 0.89% | Financial Services |
| 53 | FSV.TO | 8,814.00 | 27.46% | 10 | 10.61% | 0.62% | Real Estate |
| 54 | OTEX.TO | 12,927.00 | 165.85% | 10 | 13.31% | 2.83% | Technology |
| 55 | PBH.TO | 4,244.00 | 112.52% | 10 | 10.76% | 3.24% | Consumer Defensive |
| 56 | PKI.TO | 6,985.00 | 52.33% | 10 | 4.09% | 3.42% | Consumer Cyclical |
| 57 | SIS.TO | 916.00 | 90.48% | 10 | 9.98% | 3.66% | Industrials |
| 58 | CPX.TO | 4,435.00 | 96.76% | 9 | 6.90% | 6.49% | Utilities |
| 59 | IAG.TO | 8,744.00 | 35.37% | 9 | 12.70% | 3.59% | Financial Services |
| 60 | MFC.TO | 45,389.00 | 49.87% | 9 | 9.99% | 5.88% | Financial Services |
| 61 | GSY.TO | 1,764.00 | 31.71% | 8 | 38.28% | 3.60% | Financial Services |
| 62 | GWO.TO | 36,190.00 | 68.51% | 8 | 5.95% | 5.35% | Financial Services |
| 63 | MFI.TO | 3,187.00 | -26.30% | 8 | 12.70% | 3.18% | Consumer Defensive |
| 64 | POW.TO | 22,815.00 | 78.64% | 8 | 7.02% | 6.07% | Financial Services |
| 65 | QBR.B.TO | 6,723.00 | 45.14% | 8 | 55.38% | 4.12% | Communication Services |
| 66 | QSR.TO | 28,246.00 | 95.99% | 8 | 22.63% | 3.28% | Consumer Cyclical |
| 67 | SLF.TO | 38,889.00 | 55.63% | 8 | 9.60% | 4.53% | Financial Services |
| 68 | AEM.TO | 30,543.00 | 25.44% | 7 | 31.34% | 3.47% | Basic Materials |
| 69 | BDGI.TO | 1,196.00 | 48.98% | 7 | 9.10% | 1.99% | Industrials |
| 70 | H.TO | 20,716.00 | 65.89% | 7 | 4.90% | 3.43% | Utilities |
| 71 | X.TO | 8,134.00 | 51.26% | 7 | 11.23% | 2.47% | Financial Services |
| 72 | JWEL.TO | 1,024.00 | 58.95% | 6 | 31.95% | 3.12% | Consumer Defensive |
| 73 | ABX.TO | 34,635.00 | -1189.77% | 5 | 35.64% | 3.08% | Basic Materials |
| 74 | ALS.TO | 1,043.00 | 57.04% | 5 | - | 1.46% | Basic Materials |
| 75 | AP.UN.TO | 2,294.00 | 77.00% | 11 | 3% | 10.04% | REIT - Office |
| 76 | CAR.UN.TO | 7,546.00 | 62.50% | 11 | 0% | 3.22% | REIT - Residential |
| 77 | CRT.UN.TO | 3,219.00 | 66.67% | 10 | 3% | 6.56% | REIT - Retail |
| 78 | GRT.UN.TO | 4,595.00 | 65.00% | 12 | 3% | 4.44% | REIT - Industrial |
| 79 | IIP.UN.TO | 1,799.00 | 68.16% | 11 | 5% | 2.88% | REIT - Residential |
| 80 | KMP.UN.TO | 2,048.00 | 63.53% | 6 | 0% | 4.02% | REIT - Residential |
| 81 | MI.UN.TO | 544.00 | 62.60% | 5 | 3% | 3.59% | REIT - Residential |


